
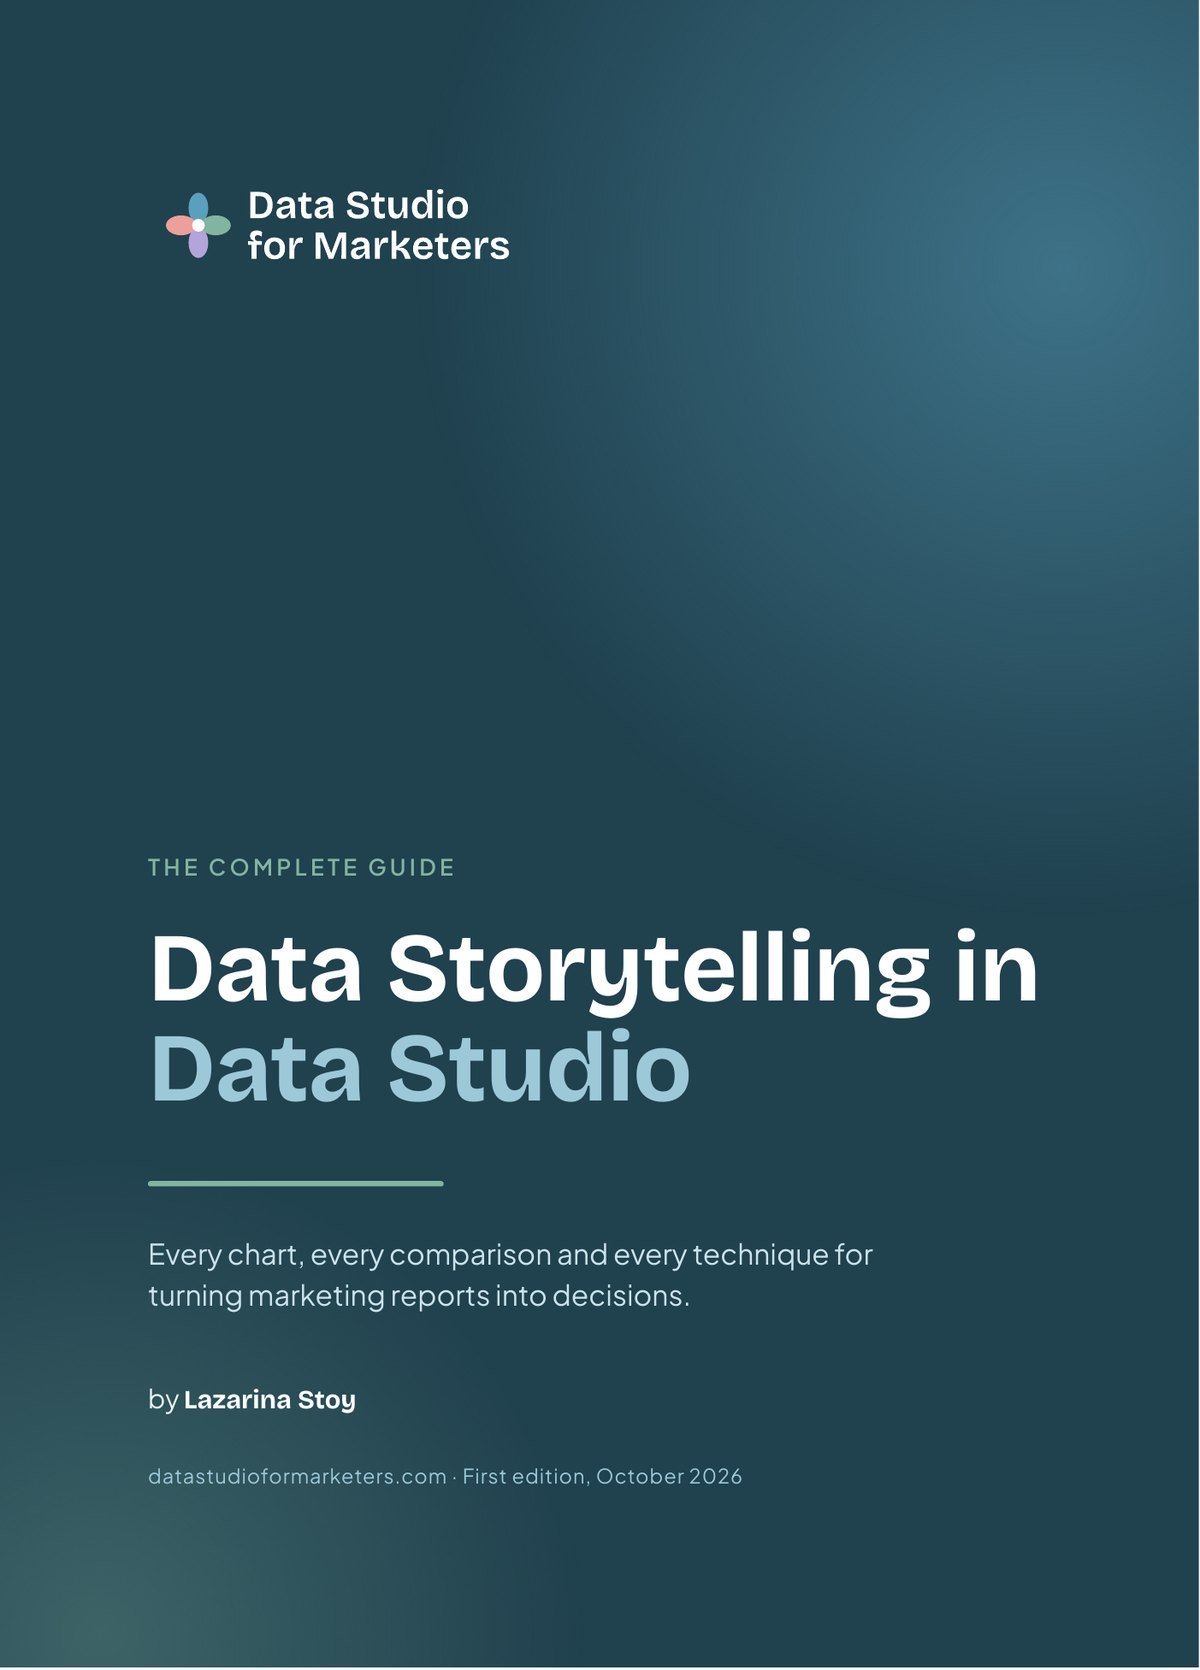
Data Storytelling in Data Studio
Every chart, every comparison and every technique for turning marketing reports into decisions.
By Lazarina Stoy · first edition, October 2026
- 33 chapters in 7 parts
- 120+ figures
- 7 report makeovers
- 311-metric workbook included
Reports that get read, and acted on
Most marketing reports are accurate and still don’t change anything. Every number is in there, but nobody can tell from them whether things are going well, why, or what to do next. This book is about closing that gap in Data Studio: deciding who a report is for and what they need to decide, giving every number something to be compared against, choosing the chart that answers the question, and writing the words that tell the reader what it means.
It’s practical from the first page. Every technique is shown on the same two fictional businesses, an online garden and homeware shop and a B2B company with a sales pipeline, so you see each idea applied to real-looking data, and every “In Data Studio” box walks you through the build step by step.
Who it’s for
Specialists who build the reports
SEO, PPC, social, email and analytics people who know the data well. You’ll learn how to turn it into a page a manager can decide from, without losing the detail you need.
Agencies reporting to clients
Account managers and analysts sending monthly reports. Get a repeatable structure for client reports and the commentary, plus advice on presenting them so the meeting ends in a decision.
In-house leads reporting upward
Marketing managers who report to a CMO, a CEO or a board. Learn what each level of reader expects: targets, benchmarks, past performance, and the one number that matters.
The book at a glance
- 435pages, PDF, read on any device
- 33chapters in seven parts, plus four appendices
- 120+figures, drawn to be legible at print size
- 163footnotes, each linking to its source
- 311metrics in the companion workbook
What’s inside
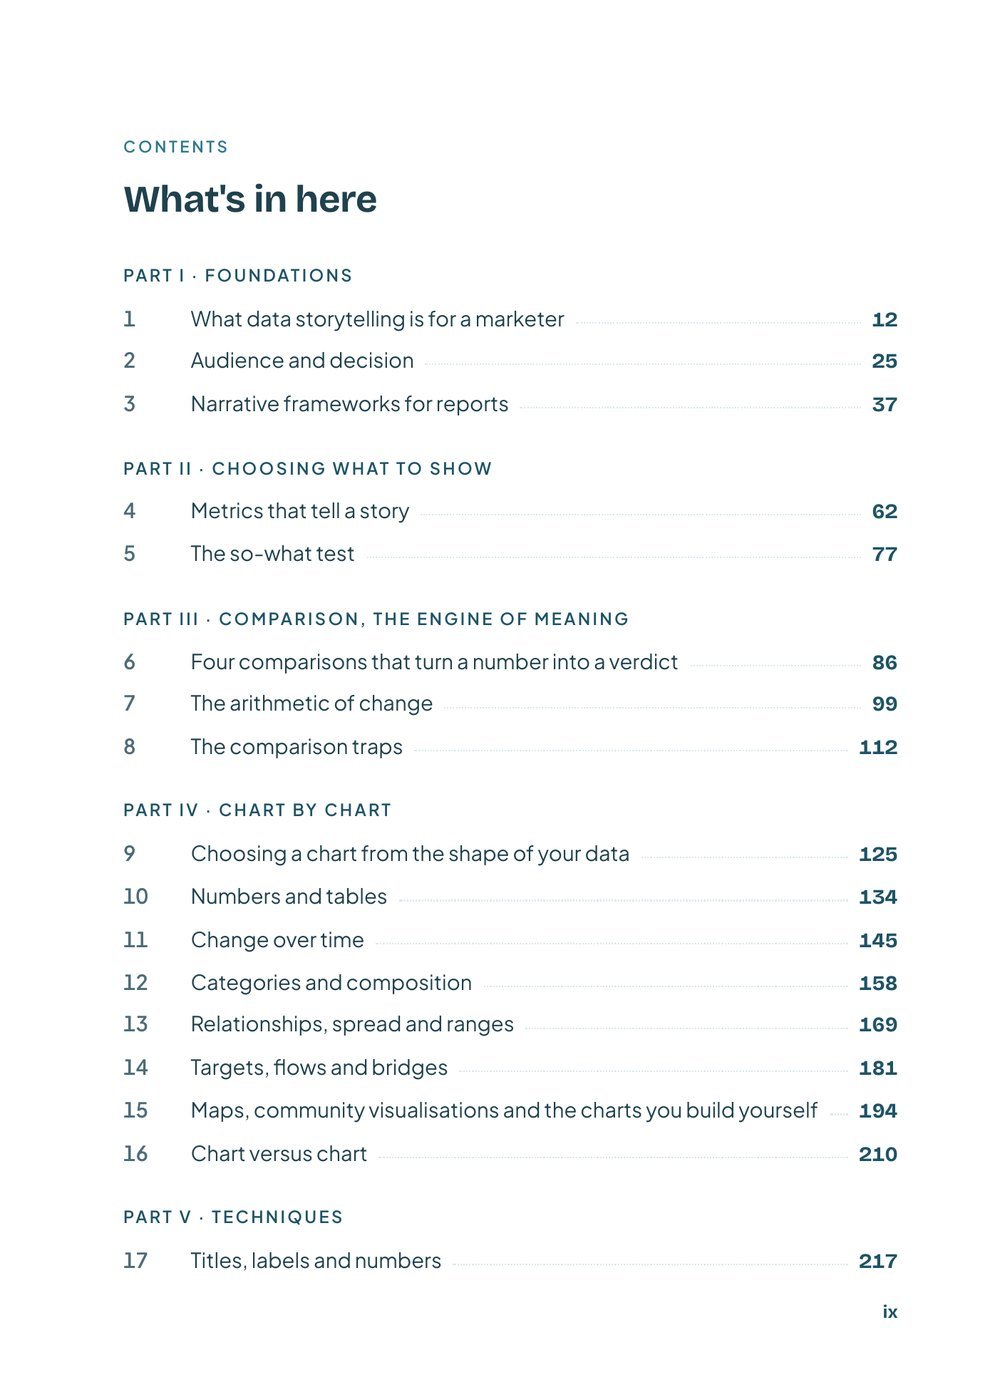
Seven parts, in the order you’d build a report: first the reader and the story, then the numbers, the charts, the techniques, the build, and finally the whole method applied to seven real report types.
What a story is, and who it’s for
Before any chart: the reader, the decision they need to make, and the narrative frameworks that put a report in the right order.
- 1What data storytelling is for a marketer
- 2Audience and decision
- 3Narrative frameworks for reports
The metrics that carry a story
Inputs and outputs, leading and lagging metrics, and the three-question test every chart has to pass.
- 4Metrics that tell a story
- 5The so-what test
The engine of meaning
A number only means something next to another number. Which comparisons to use, how to calculate change correctly, and the traps.
- 6Four comparisons that turn a number into a verdict
- 7The arithmetic of change
- 8The comparison traps
Every chart in Data Studio
Every built-in chart and its variants, with what each one is for, how to build it, the mistakes to avoid and the better alternative. Also covers the community gallery and charts you build yourself.
- 9Choosing a chart from the shape of your data
- 10Numbers and tables
- 11Change over time
- 12Categories and composition
- 13Relationships, spread and ranges
- 14Targets, flows and bridges
- 15Maps, community visualisations and charts you build
- 16Chart versus chart
The words and marks around the data
Titles, annotations, reference lines, colour, layout, the executive summary page, and commentary that stays true after a data refresh.
- 17Titles, labels and numbers
- 18Annotations
- 19Reference lines, bands and targets
- 20Colour for emphasis
- 21Layout and reading order
- 22The executive summary page
- 23Drill-down and interactivity without losing the story
- 24Caveats, uncertainty and commentary
From storyboard to meeting
Plan the report before you build it, then present it so the meeting ends in a decision.
- 25Storyboarding a report
- 26Presenting to a client
Seven before-and-after makeovers
The whole method applied to the reports marketers actually send, each shown before and after.
- 27The SEO monthly report
- 28The PPC weekly report
- 29The ecommerce performance report
- 30The social media report
- 31The executive QBR
- 32The agency client report
- 33The email report
For your desk
Reference pages to keep beside you while you build.
- AChart-chooser cheat sheet
- BThe storytelling checklist (35 checks)
- CGlossary (160 terms)
- DSources and further reading
Before and after
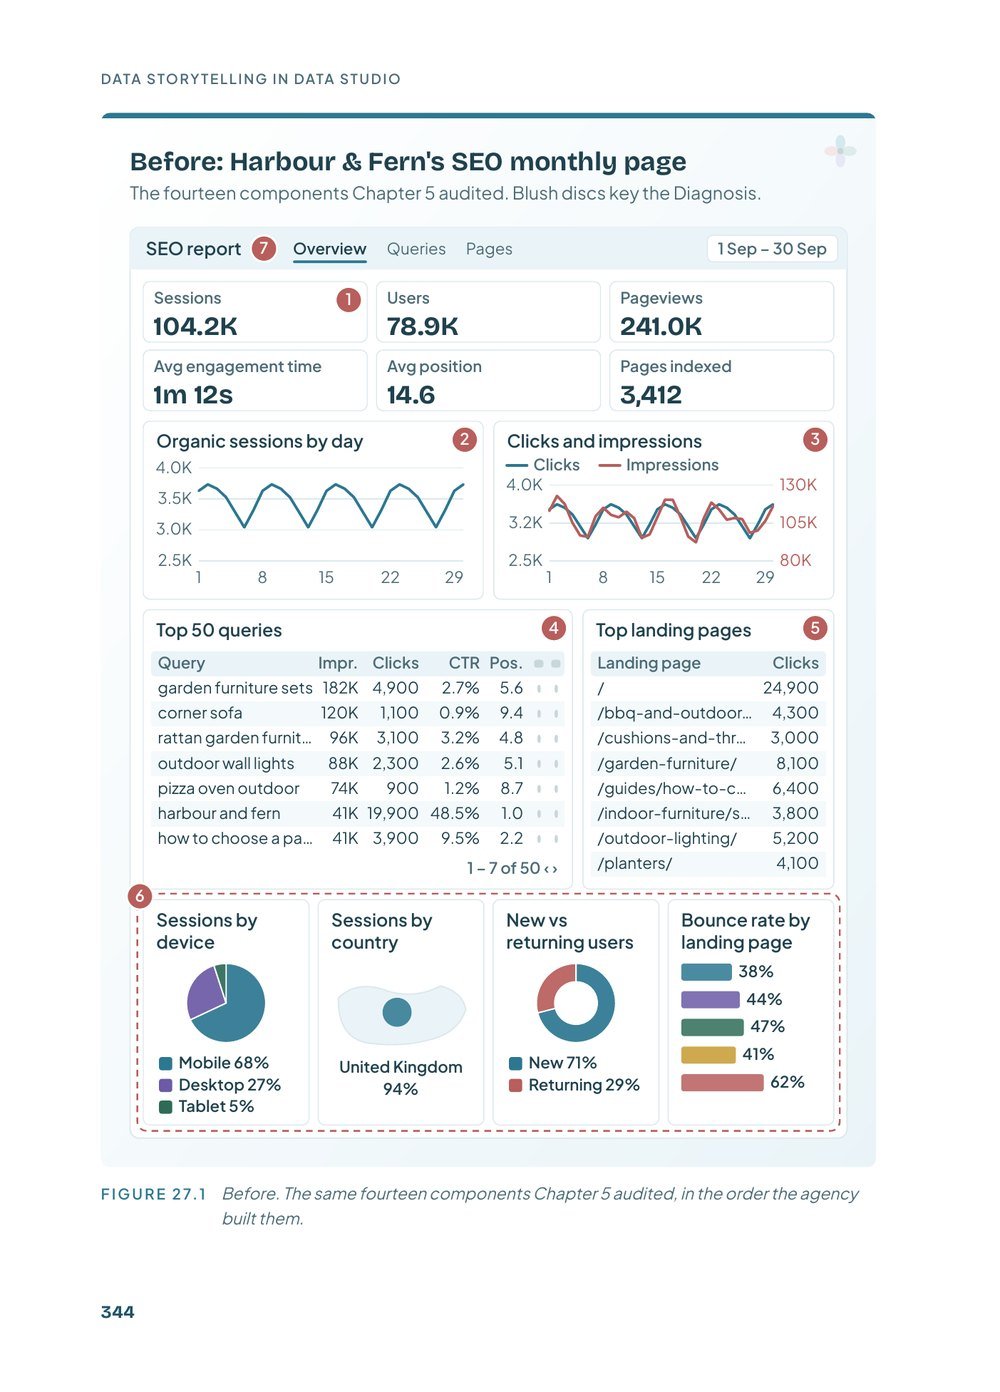
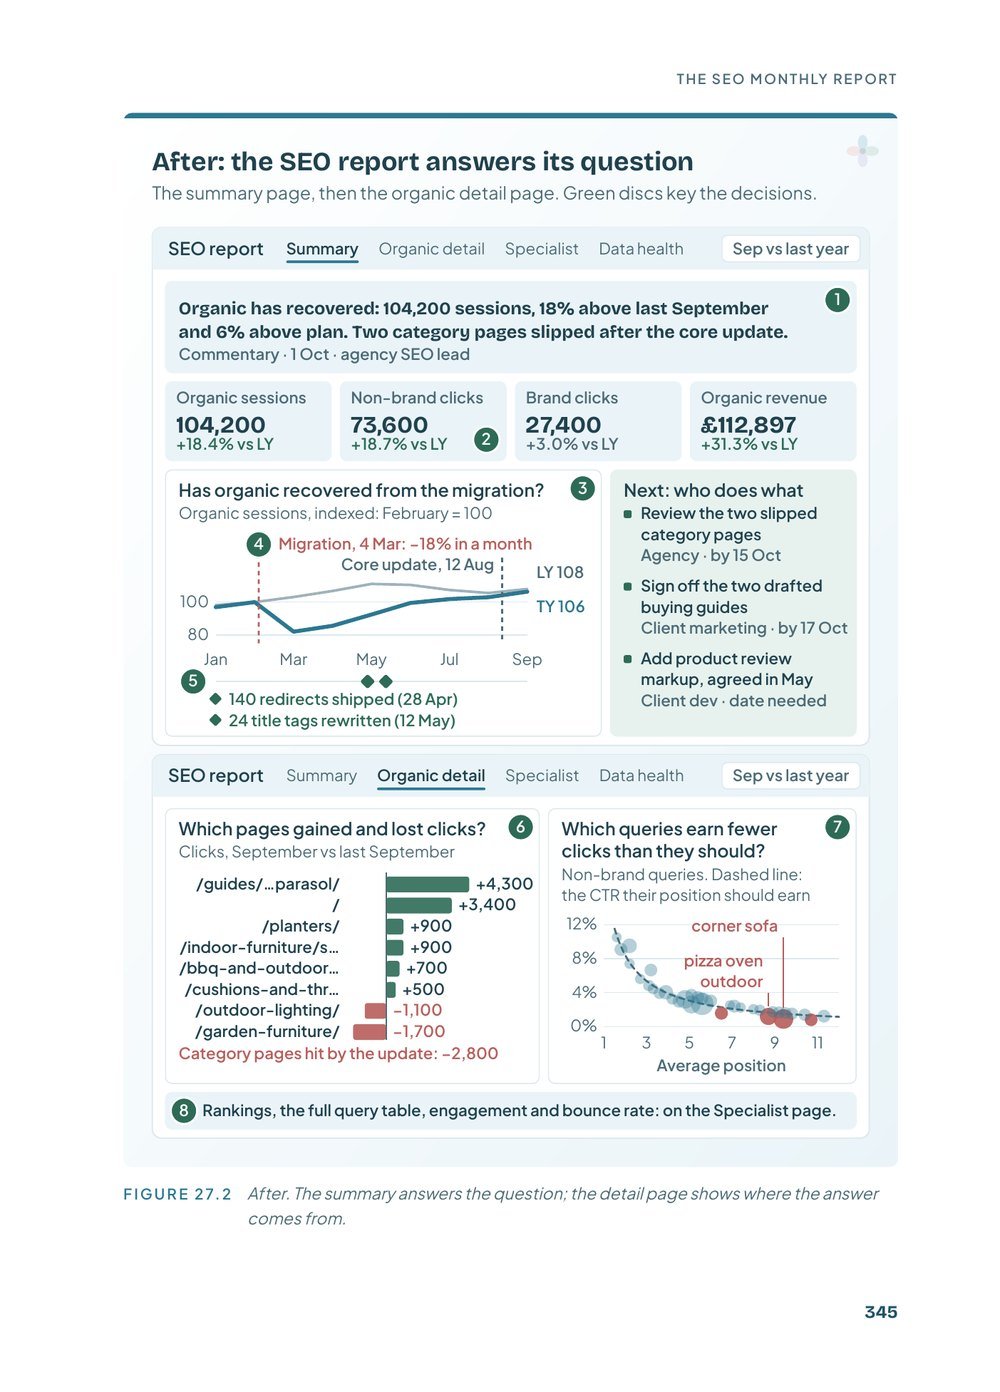
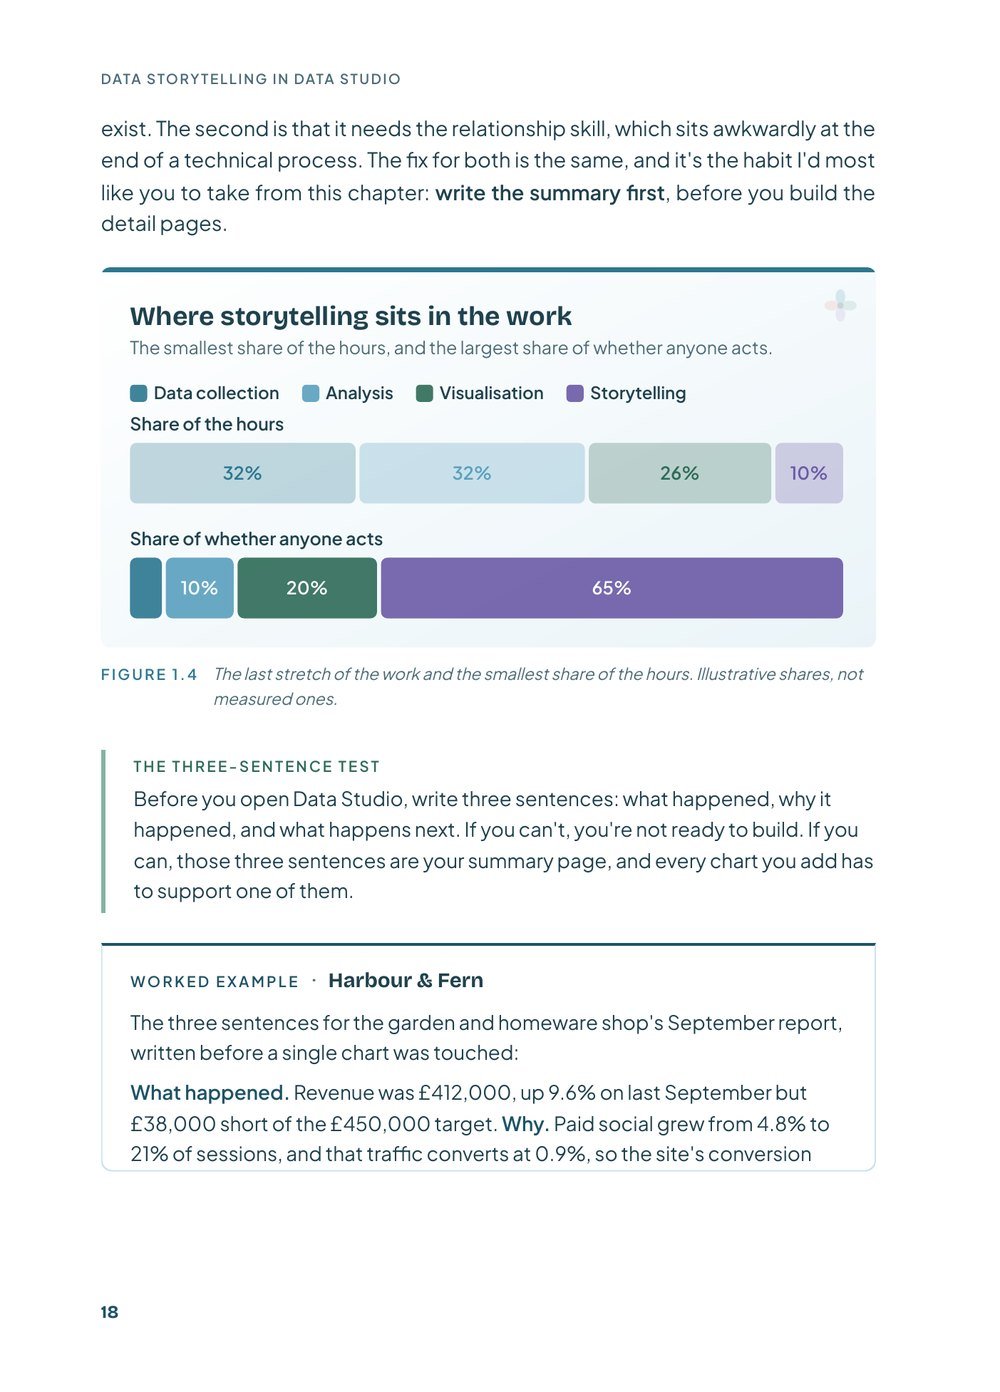
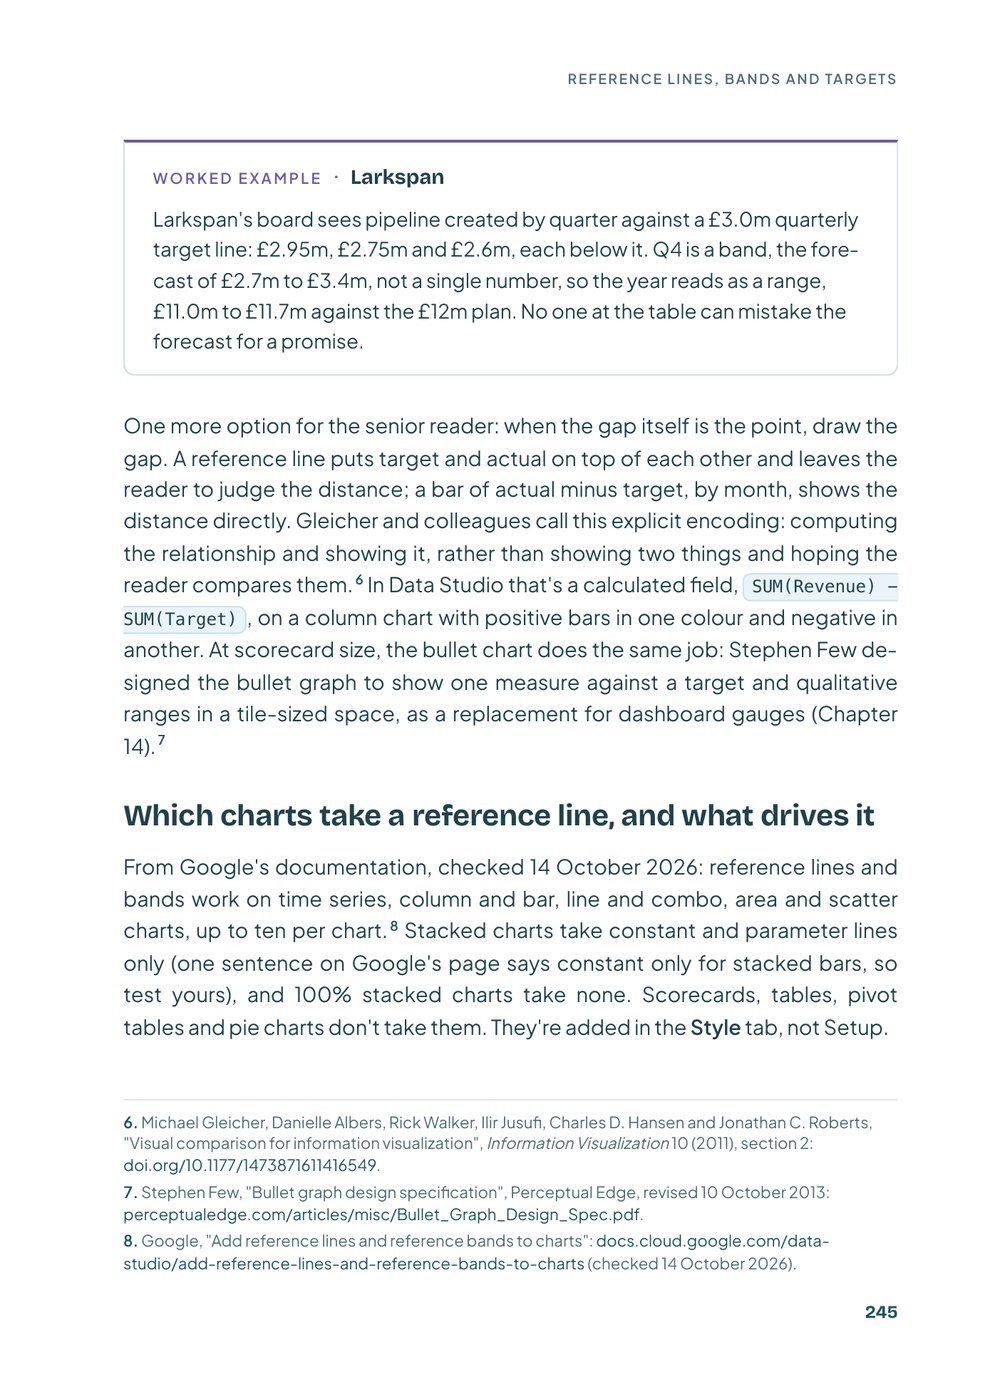
Each makeover in Part VII starts with a report as it’s usually built and redesigns it step by step. Here is the SEO monthly report: fourteen components on one page, then the same data organised so the first thing you read is the answer.
Look inside
What you get
- The ebook as a 435-page PDF, to read on screen or print
- The marketing metrics workbook in Google Sheets: 311 metrics across 18 marketing areas, each mapped from input to output
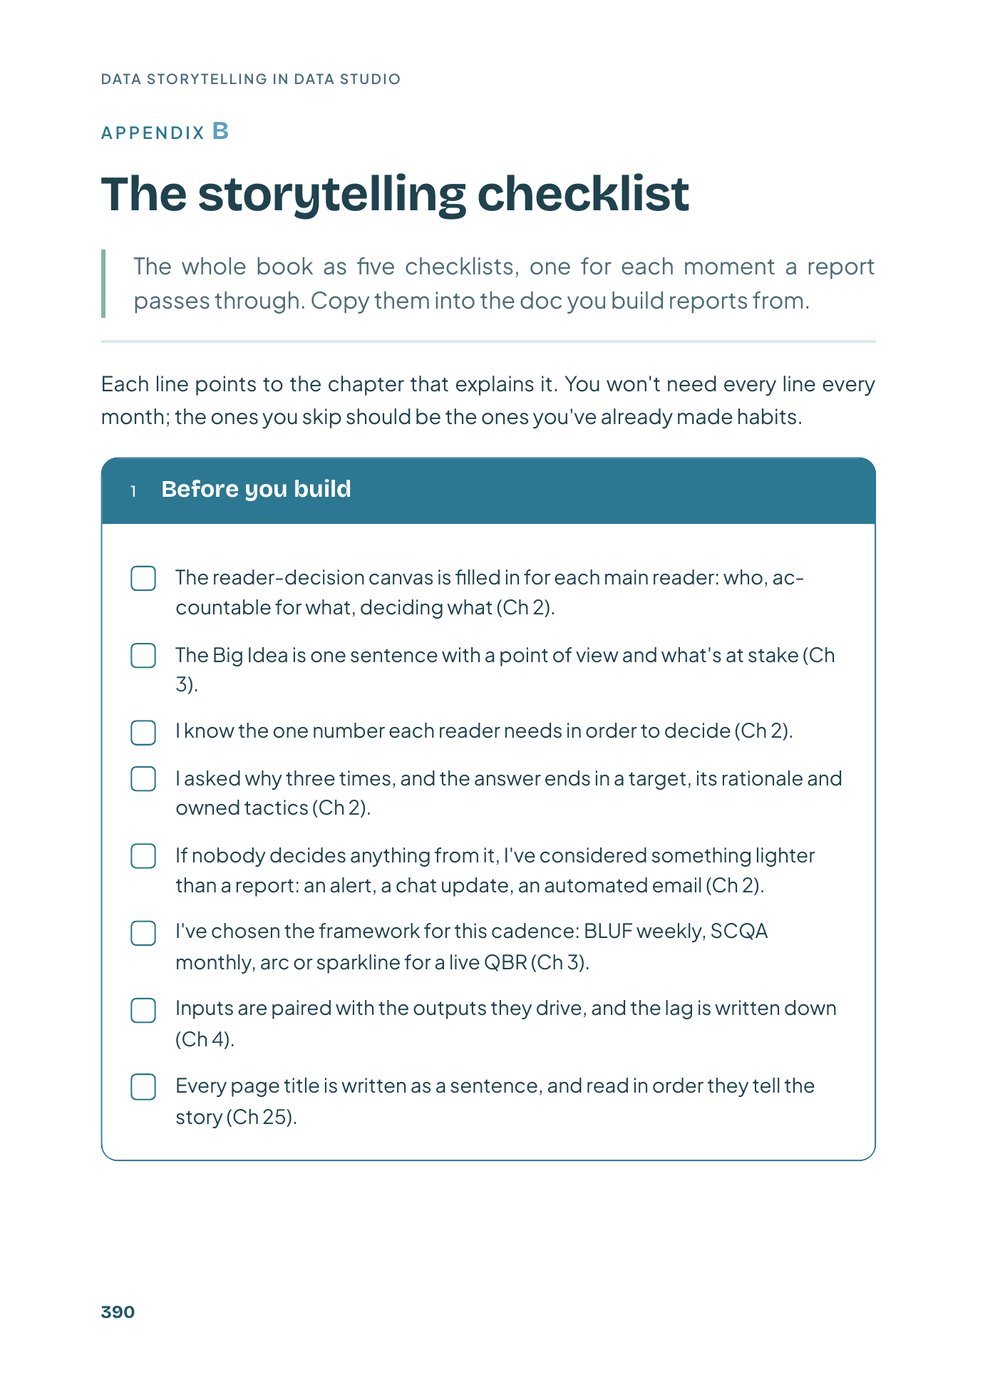
- A chart-chooser cheat sheet, the storytelling checklist and a 160-term glossary
- Links to the step-by-step tutorials and templates on the site
- Updated editions included
- A VAT invoice with your order, and team licences for 5 or 10 people
For teams and agencies
Buying for a team? A team licence lets everyone in it read the book, with one invoice in your organisation’s name. You get the same PDF and workbook. You share the file inside your team, so there are no codes or seats to manage.
At checkout you give your organisation’s name, which goes on the invoice, and confirm the size of the team. Prices include VAT. EU businesses with a valid VAT number get the VAT removed (reverse charge). Bigger team? Email team@datastudioformarketers.com.

Lazarina Stoy
Data science and visualisation specialist · founder of MLforSEO · organic marketing and automation consultant
I’ve spent years turning large, messy marketing datasets into dashboards people can make decisions from. I’ve built courses on Data Studio reporting and visualisation for SE Ranking Academy, for Traffic Think Tank (a Semrush company), for corporate teams and for this platform, along with dozens of dashboard templates.
I’ve also advised agencies on their reporting processes and redesigned how their reporting runs, and I’ve reported at every level, from the specialist who needs every query to the C-suite reader who needs one number and a decision. I speak at events including brightonSEO, WTSFest and Pubcon.
What readers say
No reviews yet. If you've read the book, I'd love to hear what you thought.
Write the first reviewFrequently asked questions
What format is the book?
A 435-page PDF with clickable links. It reads well on a laptop or tablet, and the figures are drawn to stay legible if you print it. You can download it as soon as your payment goes through, and the link is also in your order email and your account.
Data Studio or Looker Studio?
The same product. Google called it Looker Studio for a few years, and in April 2026 the name went back to Data Studio, which the book uses throughout.
How much Data Studio do I need to know?
Enough to have built a report or two. The book explains every chart and every setting it uses, and the “In Data Studio” boxes walk through each build step by step.
Does the price include VAT?
Yes. The price you see is the price you pay, wherever you are. EU businesses can enter a valid VAT number at checkout, and the VAT is removed under the reverse charge. Every order comes with a PDF invoice.
Can my team share one copy?
A single-reader copy is for one person. For a team, choose a team licence for 5 or 10 people: you get the same PDF to share inside your organisation, and one invoice in its name.
Do I get future updates?
Yes. Updated editions are included, and you can download the latest version from your account.
How was the book written?
The core comes from the trainings, courses and client work I’ve done on Data Studio reporting over the years. AI tools helped compile and organise it and assisted with parts of the writing, editing and research. I oversaw the whole process and I’m responsible for every claim, which is why every study and statistic has a footnote linking to its source.
Make your next report the one people act on
435 pages, the 311-metric workbook, and every chart and technique in Data Studio, applied to the reports you actually send.