
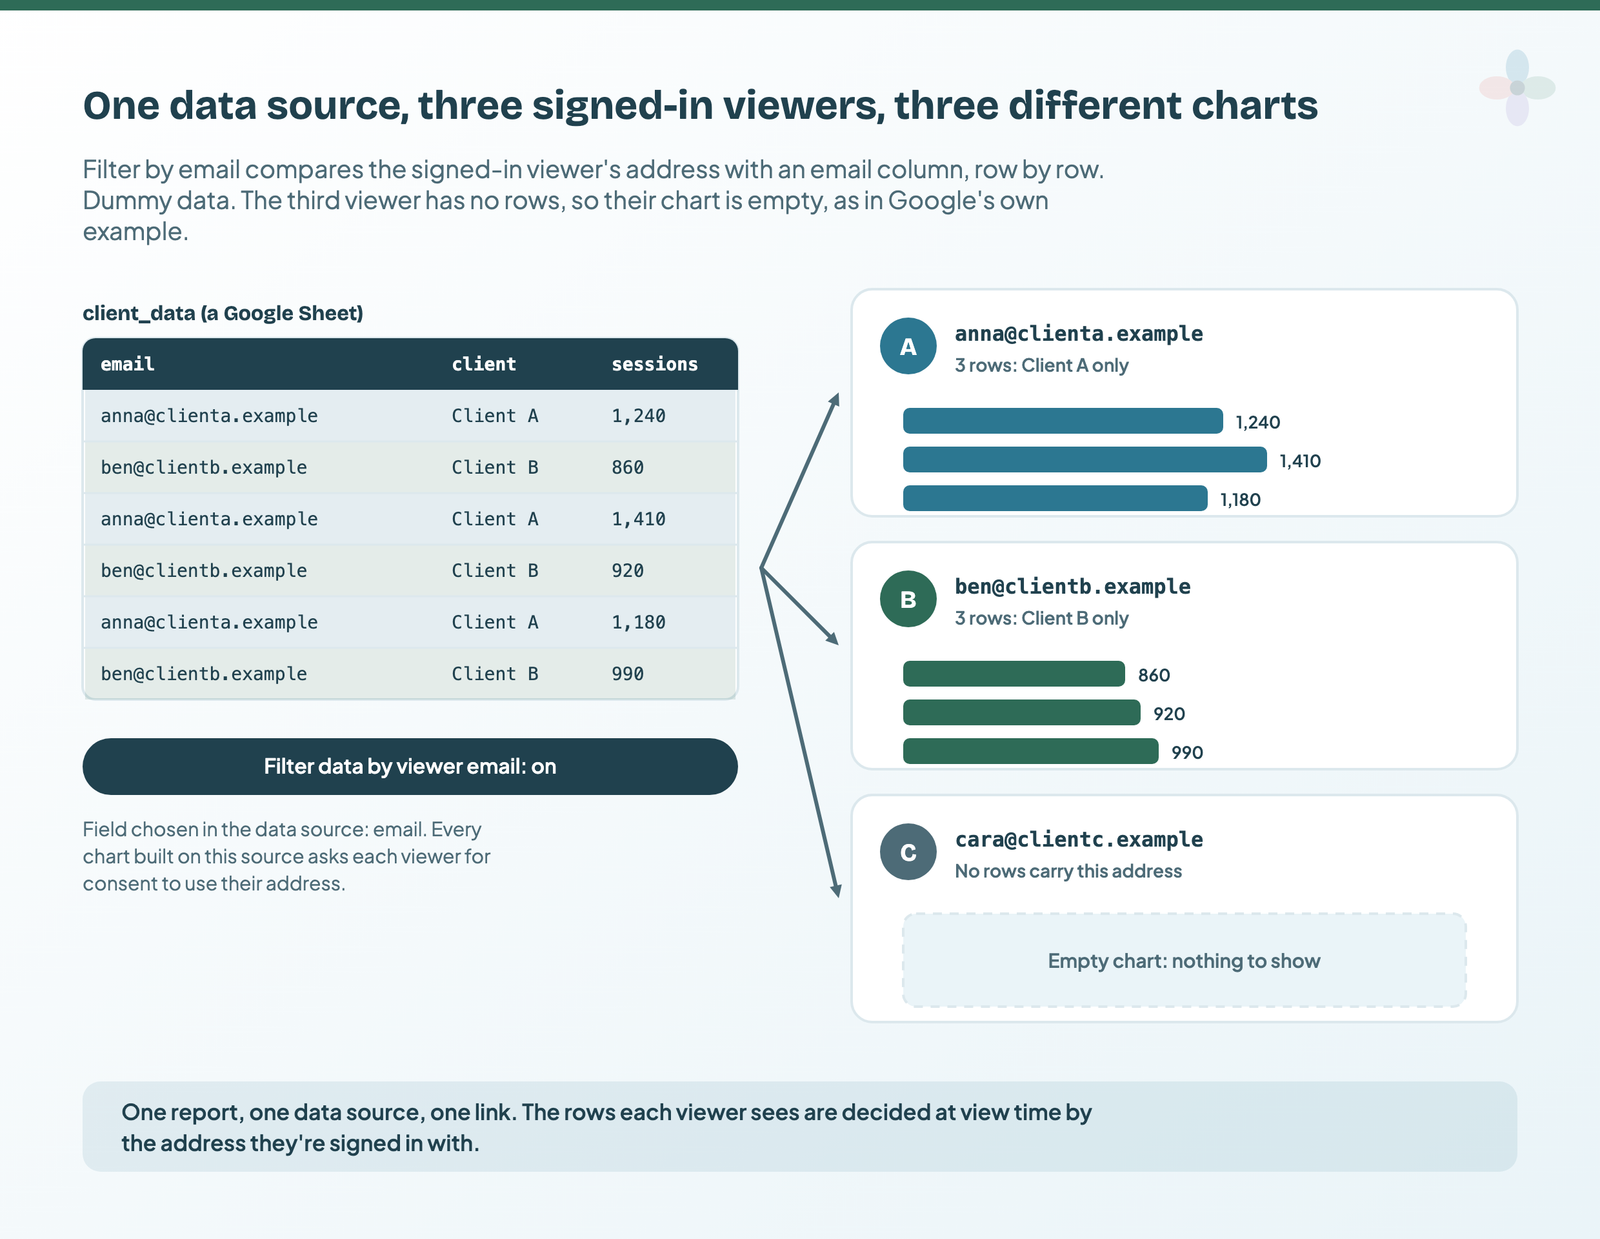
Turn on Filter by email in the data source, point it at a column of viewer email addresses, and every signed-in viewer sees only the rows that carry their address: one report, each client sees only their own data. That’s Data Studio’s row-level security. It’s free, every viewer has to sign in to a Google Account and consent to share their address, and it decides what a report shows rather than who can reach the data.
I’ve built this guide from Google’s documentation (updated 9 October 2026), fifteen threads on Google’s Data Studio forum from 2024 to 2026, and the guides that rank for it. I haven’t been able to run the Pro scheduled version or BigQuery for this post. Where something is Google’s description rather than something I’ve seen, I say so.
This covers:
- how filter by email works in Data Studio (formerly Looker Studio), and the setup on a Google Sheet;
- the mapping table that lets several people see one client, and lets you see every client;
- getting GA4 and ads data into a shape you can filter;
- BigQuery’s
@DS_USER_EMAILparameter, with SQL you can copy; - what viewers see, the Pro-only scheduled version, the usual fixes, and what the filter doesn’t protect.
If you’re working out the whole client-reporting setup rather than just access, start with what free Data Studio automates and what needs Pro.
What filter by email does, in one picture
Row-level security means each viewer sees only the rows that belong to them. Data Studio does it in the simplest way possible: it compares the email address of the signed-in viewer with a field in the data source, row by row, and returns only the rows that match. Google’s docs say it’s available for any kind of data source, as long as the data contains a field holding viewers’ addresses.
Two things share the name and aren’t this. Looker, Google’s separate enterprise BI product, has its own access filters, and its pages fill half the search results for this term. And BigQuery has its own row access policies, which work inside the warehouse. Filter by email is the Data Studio feature, set in the data source, and it only needs a column of addresses.
The one decision that matters before you start is which credentials the data source uses. I cover sharing and credentials in detail in my guide to sharing and scheduling; the short version is in the next section.
Before you start: five things that must be true
Most “filter by email shows nothing” threads come down to one of these. Check them on your data before you build anything.
| Requirement | Why it matters | What happens if it isn’t true |
|---|---|---|
| A column with the viewer’s full address | The filter matches the whole address, not a name or a domain | No rows match; empty charts |
| One address per row | Google: a list of addresses in the email field won’t work | Rows with two addresses match nobody |
| The case matches the account exactly | Google’s example: “Bob@…” in the account and “bob@…” in the data don’t match | That viewer sees nothing |
| Every viewer has a Google Account and signs in | Required even if the report is shared publicly | Anonymous viewers never see filtered data |
| Every viewer consents | Each chart on the source asks for permission to use their address | Charts show only the consent request |
Then credentials. Google’s filter-by-email pages don’t say which credential type it needs, so this is my reasoning rather than a documented rule: owner’s credentials is the setup that makes sense. With owner’s credentials, viewers see the data through your access, which is what lets a client see their rows without access to your Sheet. With viewer’s credentials, each viewer would already need their own access to the whole dataset, which defeats the point. My post on data sources and credentials explains the difference.
Set it up on a Google Sheet, step by step
The setting itself is five clicks. The test afterwards is what tells you it works. You need a Sheet with an email column (or the companion Sheet below) connected to Data Studio, and a second Google account to test with.
- Lay out the sheet. One row per record, with a column holding the address of the person allowed to see it, written exactly as their Google Account shows it.
- Edit the data source. In the report, open Resource → Manage added data sources and click Edit on the Sheet’s source, then click FILTER BY EMAIL.
- Tick “Filter data by viewer email” and select the field that holds the addresses. Click ALL FIELDS to go back to the editor.
- Share the report with your test account (or by link). Leave the Sheet itself unshared.
- Open the report as someone else. Sign in as the second account, or open the link in an incognito window to see the sign-in wall first. Each chart on the filtered source should ask for permission to use the viewer’s email.
- Compare two viewers. After consent, each account should see only its own rows; an address with no rows sees empty charts.
Open it as yourself too. If you’re the owner and your own address isn’t in the data, you’ll see nothing. That’s not a fault, and the next section fixes it.
Several people per client, and you seeing every client: the mapping table
The filter matches one address per row, and it filters everyone in view mode, the owner included. Four of the fifteen forum threads I read are some version of “the owner, a manager or a supervisor needs to see more than one person’s rows”, usually discovered as “I’m the owner and I see nothing”. The most common reply is to make an unfiltered copy of the report. That works, and it doubles the upkeep.
Google’s own answer is better: a small access table (Google calls it an access control list) that pairs addresses with a key, blended with your data. The steps from Google’s multiple-addresses page:
- Make a table with two columns:
emailandclient_key. One row per person per client. - Make sure your data has the same key values (it doesn’t need an email column at all, and the field names don’t have to match: blends join on values).
- Turn on filter by email on the access table’s data source, on its email field.
- Blend them: start from the access table and left-join the data table on the key. Build the client charts on the blend.
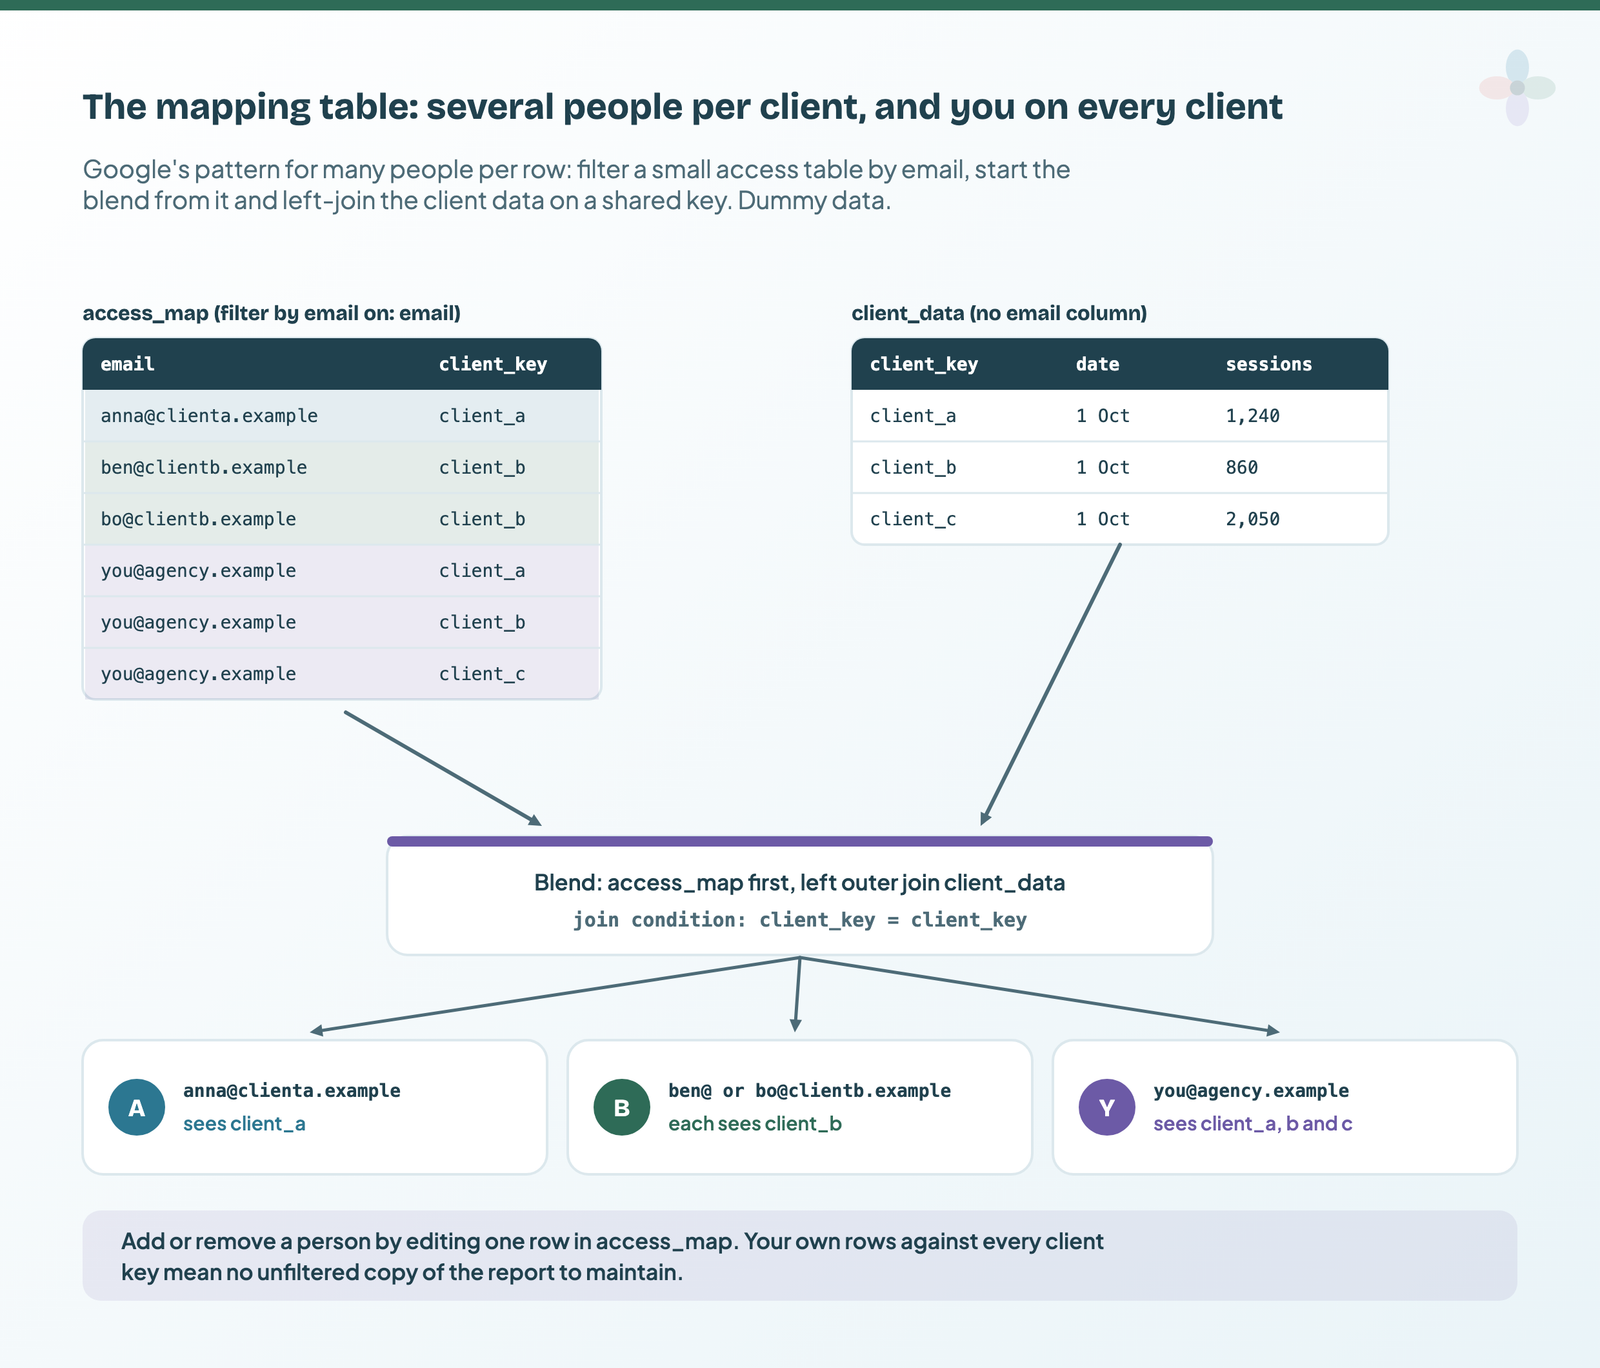
Now add your own team’s addresses against every client key you need to see. One report serves every client and the agency, with no unfiltered copy to maintain. Adding a contact or removing a leaver is one row. A text box shows every client the same words, so per-client commentary has to come from the data too: the commentary sheet from Chapter 24 of my ebook, Data Storytelling in Data Studio, with a client_key column added.
Two details. Google’s doc has changed direction: a December 2024 forum thread quotes an older version that started from the data table and left-joined the access table. The current wording, which I follow, is the reverse. And a blend can combine up to five data sources, so the access table takes one of the five.
Getting GA4, Ads and Search Console data into a shape you can filter
Filter by email needs one data source that holds several clients’ rows, with a column saying which client each row belongs to. That’s where most agency data isn’t. A GA4 property or a Search Console site is one client, so there’s nothing to filter: everyone who sees it sees all of it.
The shape you want is one consolidated table, in Google Sheets or BigQuery:
| Column | Example | Why it’s there |
|---|---|---|
date |
2026-10-01 | Date range controls and trends |
client_key |
client_a | The join key to the access table |
client_name |
Client A | What the report shows |
channel / source |
Paid search | Breakdowns within each client |
| metrics | sessions, conversions, cost | The numbers |
You fill it with a connector that writes to Sheets or BigQuery (Supermetrics, Windsor.ai, Coupler.io and Catchr all do; my connector comparison covers which suits which setup), or with your own exports. Add a client_key as the data lands.
One trap with Google Ads. Its connector can cover up to 50 sub-accounts of a manager account in one data source, which looks like the multi-client table you want. But Google’s doc says report viewers also need access to the manager account and every selected sub-account to see the data. I couldn’t test whether owner’s credentials change that, so I wouldn’t build client access on a manager-account source without testing it first.
BigQuery: filter in the query with @DS_USER_EMAIL
If your data is in BigQuery, you can skip the checkbox and filter in SQL. In a custom query, the parameter @DS_USER_EMAIL carries the signed-in viewer’s address. Google’s rules for it:
- enable it in the Parameters section of the connection panel (Data Studio asks for your email consent when you do);
- type parameter names in uppercase;
- values arrive as text;
- a viewer who doesn’t consent gets an authorisation error on every chart from that source.
Why bother? Because you write the comparison, three of the checkbox’s limits go away: you can check several email columns, give admins every row, and match case-insensitively with LOWER(). The queries below were written from Google’s parameter docs, not run against a live project for this post. Replace the project and table names with yours.
Google’s own example uses sales-rep-email, which isn’t a valid unquoted column name in BigQuery. With an underscore:
SELECT *
FROM `my-project.reporting.sales`
WHERE sales_rep_email = @DS_USER_EMAIL
The mapping-table version. EXISTS rather than a join, so a duplicated row in the access table can’t double anyone’s numbers, and the report’s date range passed through with @DS_START_DATE and @DS_END_DATE, which also arrive as text:
SELECT d.date, d.client_name, d.channel, d.sessions, d.conversions, d.cost
FROM `my-project.reporting.client_daily` AS d
WHERE EXISTS (
  SELECT 1 FROM `my-project.reporting.access_map` AS a
  WHERE a.client_key = d.client_key
    AND LOWER(a.email) = LOWER(@DS_USER_EMAIL)
)
AND d.date BETWEEN PARSE_DATE('%Y%m%d', @DS_START_DATE)
               AND PARSE_DATE('%Y%m%d', @DS_END_DATE)
And the admin override, so your team sees every client. Note the brackets around the EXISTS and the OR: without them, AND binds first and the date range only applies to the client side:
SELECT d.date, d.client_name, d.channel, d.sessions, d.conversions, d.cost
FROM `my-project.reporting.client_daily` AS d
WHERE (
  EXISTS (
    SELECT 1 FROM `my-project.reporting.access_map` AS a
    WHERE a.client_key = d.client_key
      AND LOWER(a.email) = LOWER(@DS_USER_EMAIL)
  )
  OR LOWER(@DS_USER_EMAIL) IN (
    SELECT LOWER(email) FROM `my-project.reporting.report_admins`
  )
)
AND d.date BETWEEN PARSE_DATE('%Y%m%d', @DS_START_DATE)
               AND PARSE_DATE('%Y%m%d', @DS_END_DATE)
The companion Sheet has all three, with a TRIM() added in case the access table picked up stray spaces.
The parameter syntax follows BigQuery’s rules for parameterised queries, and the full list of Data Studio’s parameters is on Google’s custom-query parameters page.
What your viewers see: sign-in, consent, unlisted links and embeds
This is the section to read before you send the link, because it’s where the “it’s empty” emails come from.
| How you shared the report | Without a filtered source | With filter by email |
|---|---|---|
| Invited specific people | Sign in, view | Sign in, consent, see their rows |
| Unlisted or public link | Anyone can view, no Google account needed | The link opens, but filtered charts need sign-in and consent |
| Embedded, shared with specific people | Viewers must be signed in to Google | Signed in, plus consent |
| Embedded, public | Anyone on the page sees it | Filtered charts still need sign-in; Google doesn’t document how the consent prompt behaves inside an embed |
Your clients don’t need Gmail. Any Google Account works, and you can create one on an existing work address. Consent is given per data source and can be withdrawn: Settings → Revoke Consent, then Revoke all under Revoke user email, after which the viewer has to consent again to see their data.
If you want clients to see their data in a portal without signing in to Google, filter by email can’t do it. Google’s documented route is a community connector that receives a per-user token in the embed URL (it recommends short-lived tokens), described in its embedded row-level security guide. My post on embedding a Data Studio report in a client portal covers the rest, and sharing by link covers what an unfiltered link exposes.
Scheduled emails: the per-recipient filter is a separate, Pro-only feature
Filtering what a signed-in viewer sees is free. Sending each recipient their own rows by scheduled email is a different feature, Filter by recipient email address, and Google’s scheduling page lists it as a Data Studio Pro feature.
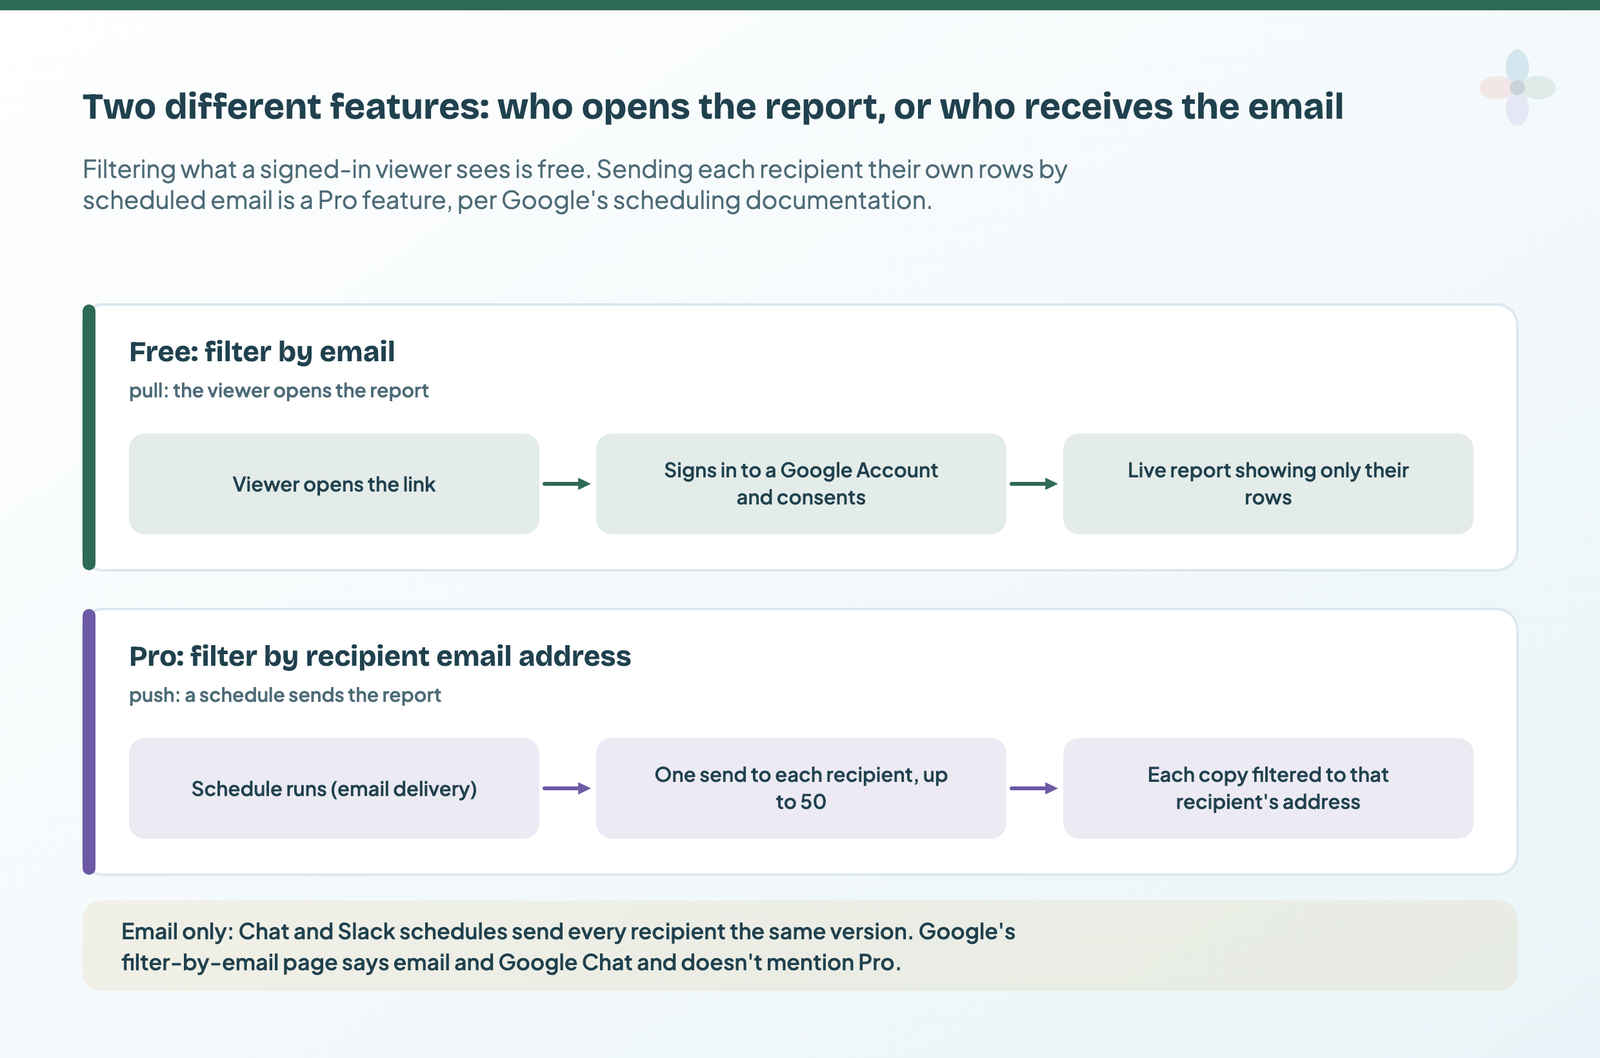
How it works, per that page: you specify an email field for each data source in the report you want to personalise, and the option “Filter the delivered report data by recipient’s email address” then appears when you create or edit the schedule. It’s for email delivery only. Chat and Slack schedules send every recipient the same version. A schedule can have up to 50 recipient addresses, so one Pro schedule could reach 50 people with 50 different versions; that’s my reading of the two limits together, not something I’ve run.
A note on Google’s docs: they disagree. The filter-by-email page says email filters can be included in reports delivered “by scheduled email and Google Chat”, and doesn’t mention Pro. The scheduling page is the specific one (a Pro label, and an explicit “not for Chat or Slack”), so that’s what I follow here.
| Free | Data Studio Pro | |
|---|---|---|
| Filter what a signed-in viewer sees | Yes | Yes |
| Schedules per report | 1 | Up to 200 (where the report owner has Pro) |
| Highest frequency | Daily | Hourly |
| Filter each email by recipient | No | Yes, email only |
| Recipients per schedule | Up to 50 | Up to 50 |
| Scheduled-email quota | 200 a day and 800 a month (individual); 500 and 3,000 (Workspace) | Unlimited |
Data Studio Pro is $9 per user, per project, per month (Google’s product page, checked 14 October 2026; the page notes the per-user price varies with subscription length), with a 30-day trial that starts billing automatically. Free vs Pro has the full comparison, and if a schedule doesn’t arrive, why a scheduled report didn’t send walks through the causes. The quotas and frequency limits are in the scheduling section of my sharing guide.
When it shows nothing: fixes for the usual failures
From Google’s limits and the forum threads I read (dates are when each was asked):
| Symptom | Likely cause | Fix |
|---|---|---|
| Empty for one viewer | Case or domain spelling differs from their account (Sept 2025) | Copy the address exactly as their Google Account shows it |
| Empty for you, the owner | You’re filtered too (Oct 2025) | Add your address to the access table against every client |
| Consent prompt loops on a blended chart | Consent hasn’t been granted on the filtered source itself (Mar 2025) | Add a chart or control built directly on the access table and allow it there |
| “Consent required” everywhere in a Workspace organisation | A Context-Aware Access rule blocking the request (Mar 2025) | Ask the Workspace admin to check access rules |
| Rows with several addresses show for nobody | A list in one cell | One address per row, in an access table |
| A Google Group address never matches | Viewers sign in as themselves, not as the group (May 2025) | List the people individually |
A tutorial’s DS_USER_EMAIL calculated field errors |
It isn’t in Google’s current function list; Google documents it only for BigQuery custom queries | Use filter by email, or the BigQuery parameter |
| Two roles need two email fields | Only one field can drive the filter (Mar 2025) | One access table with both roles, or BigQuery |
| Anonymous viewer gets a sign-in wall | By design, even on a public report | Ask them to sign in, or use another approach |
For empty charts that aren’t about email at all, the checks in my filter-controls post apply.
What filter by email doesn’t protect
Filter by email limits what a report shows to a signed-in viewer. It doesn’t control access to the data, and it’s worth being exact about the difference before you put client data behind it.
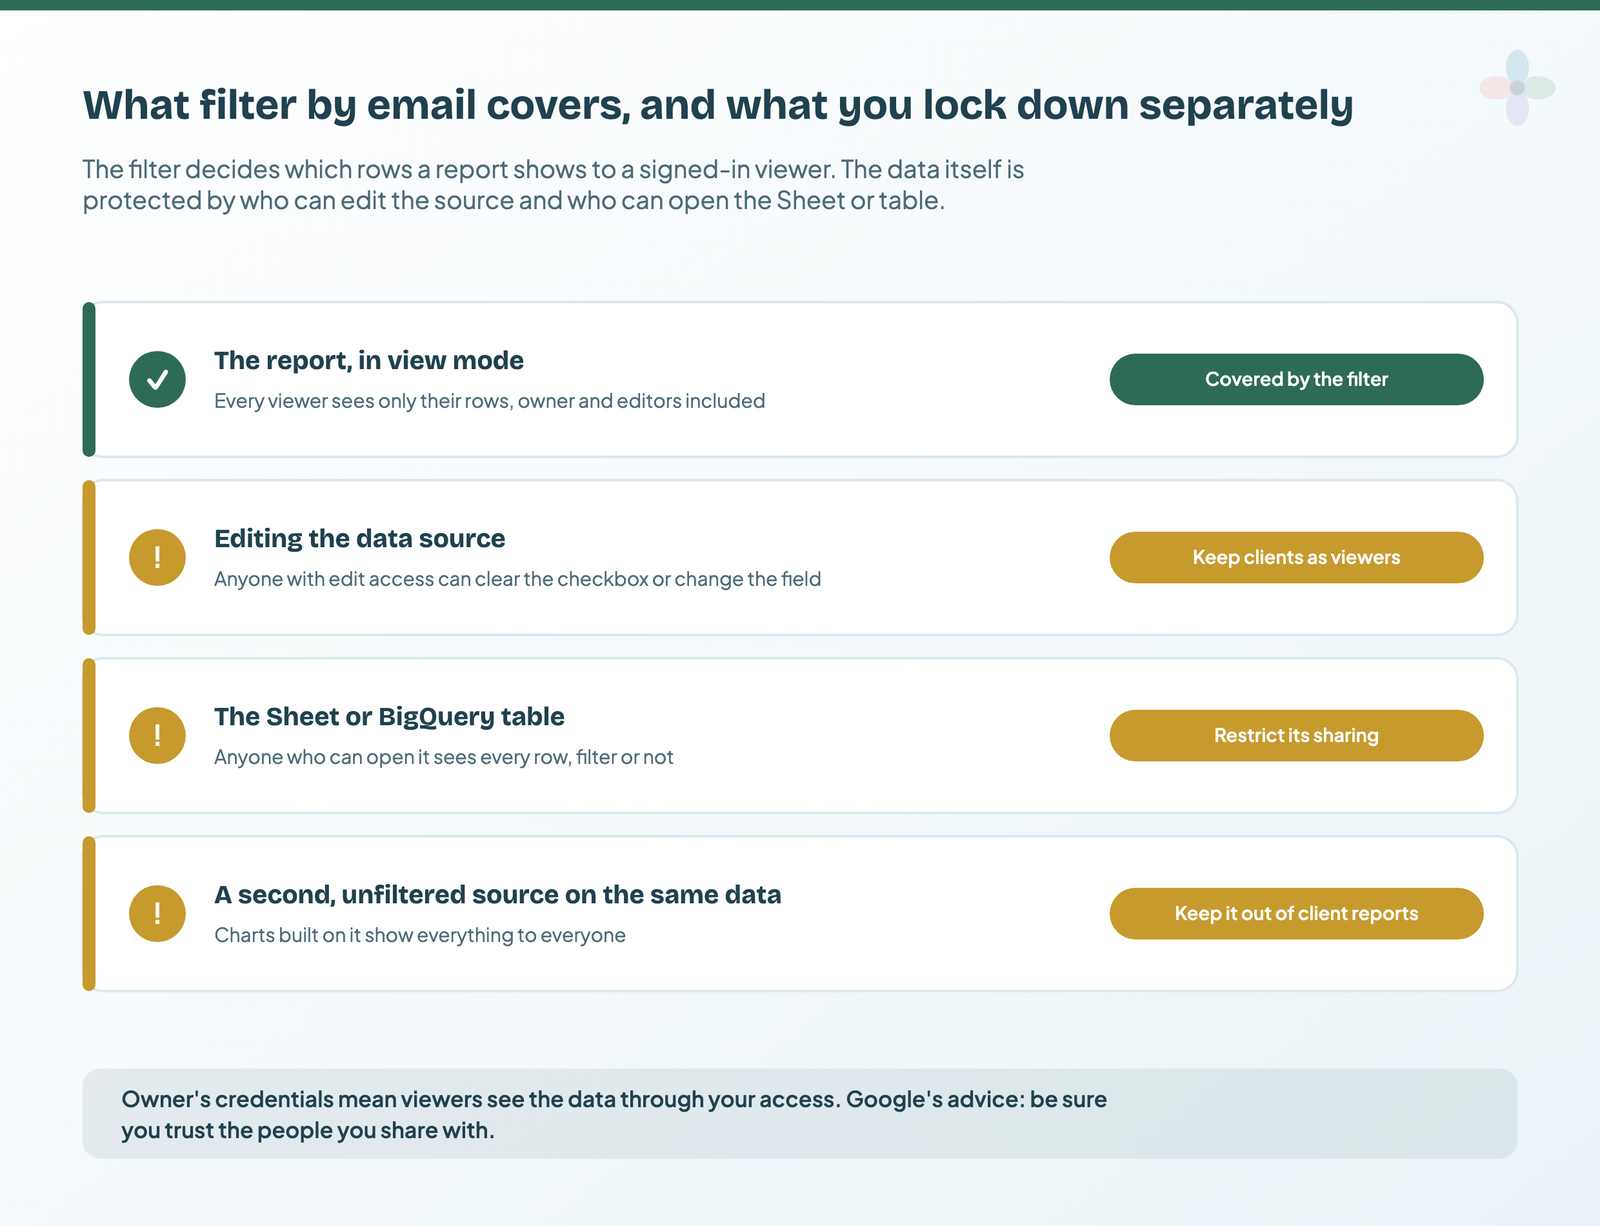
- Editors can switch it off. In view mode everyone is filtered, owner included. But anyone who can edit the data source can clear the checkbox, or change which field it uses, or rename and add fields.
- The source data isn’t filtered. Anyone with access to the Sheet or table sees every row and every address.
- A second source leaks. An unfiltered data source on the same data, anywhere in the report, shows everything to everyone.
- Owner’s credentials are trust. Google’s own warning on credentials is to be sure you trust the people you share with.
- Copies aren’t covered by the docs. A Pro personal report link makes a copy of the entire report, hidden pages included, owned by whoever opens it. Google doesn’t say whether the email filter survives in that copy, so I wouldn’t send one on a filtered report.
For client data, then: lock the Sheet or table to your team, keep clients as viewers only, consider “Disable options to download, print, and copy for viewers” in the report’s sharing settings, keep unfiltered sources out of client reports, and use a copy per client or separate datasets wherever a mistake would matter. My post on copying data sources explains what a copy carries with it. Who owns the reports when someone leaves is its own question, covered in report ownership and offboarding.
Filter by email, or something else?
| Approach | Best when | Trade-off |
|---|---|---|
| Filter by email | One report, signed-in clients, data in one table | Sign-in and consent; not access control |
BigQuery @DS_USER_EMAIL |
Several roles, admin access, case-insensitive matching | Needs BigQuery and SQL |
| A copy per client | No sign-in, strongest separation | More upkeep; at scale, look at the Linking API |
| Viewer’s credentials | Internal teams who already have platform access | Each viewer needs their own access |
| A data control | Switching between accounts the viewer can already reach | Everyone sees the default dataset first; it isn’t a filter |
| Embed token connector | A portal without Google sign-in | A community connector to build |
| Pro per-recipient schedules | Push each client their own PDF | Pro, email only |
Data controls are covered in my filter-controls post, and the bigger operating picture in agency reporting operations.
Where to go next
- Sharing and scheduling Data Studio reports: credentials, links and schedules
- Data sources vs datasets: embedded vs reusable, credentials, copying
- Connecting Google Sheets to Data Studio
- Embedding a report in a client portal
- Automated client reporting in Data Studio
- Agency reporting operations
Frequently asked questions
Is filter by email free?
Yes. Filtering what a signed-in viewer sees costs nothing. The scheduled version, where each email recipient gets their own rows, is a Data Studio Pro feature.
Does it work with an unlisted or public link?
The link opens, but every chart on the filtered source needs the viewer to sign in to a Google Account and consent. Anonymous viewers never see filtered data.
Do my clients need Gmail?
No. Any Google Account works, including one created on their work address.
Can I see all my clients while the filter is on?
Yes: add your address against every client in the access table, or add an admin clause to a BigQuery custom query. Without either, you see only rows with your own address.
Can I use DS_USER_EMAIL in a calculated field?
It isn’t in Google’s current function list. Google documents the viewer’s email only as a parameter in BigQuery custom queries.
Is it secure enough for client data?
It filters what the report shows; it doesn’t protect the data underneath. Lock the Sheet or table, keep clients as viewers, and keep unfiltered sources out of client reports.
Some links in this post are affiliate links: if you sign up through one, I may earn a commission at no extra cost to you. How I work with partners.