
To keep the Google Sheet behind a Data Studio report filled without anyone touching it, give the Sheet its own schedule (an Apps Script time-driven trigger, an import formula, or a connector add-on), and remember that Data Studio adds up to 15 more minutes of caching on top. Which one fits depends on where the data comes from and how stale you can live with.
To automate Google Sheets for a report, you have two jobs: filling the Sheet, and getting Data Studio (formerly Looker Studio) to show what landed. This covers:
- the two clocks behind every Sheet-backed chart, and how old a number can get
- five ways to fill a Sheet on a schedule, compared in one table
- an Apps Script that appends and skips duplicates instead of wiping the tab
- the Sheet rules that stop the data source breaking, and what to check when the numbers stop moving
Connecting a Sheet in the first place is in my guide to connecting Google Sheets to Data Studio. The evidence here is Google’s documentation (read 13 October 2026), vendor pages and Google’s Data Studio forum. The intervals are theirs; I haven’t run a timing test.
How a Sheet-backed report actually updates
Google says two things about Sheets data sources that sound contradictory and are both true:
- Data Studio checks the Sheet for changed values and new rows every time a query runs on a report that uses it.
- It also caches queries for the data freshness interval: 15 minutes by default for Google Sheets, adjustable to 1, 4 or 12 hours.
The trick is the word query. Data freshness is how long Data Studio may answer a chart from memory. A query it has seen within that window gets the remembered answer; a new one (a different date range, a new filter, a chart nobody has loaded yet) goes to the Sheet. Google promises the data “won’t be older than” the setting, not that it stays cached for all of it.
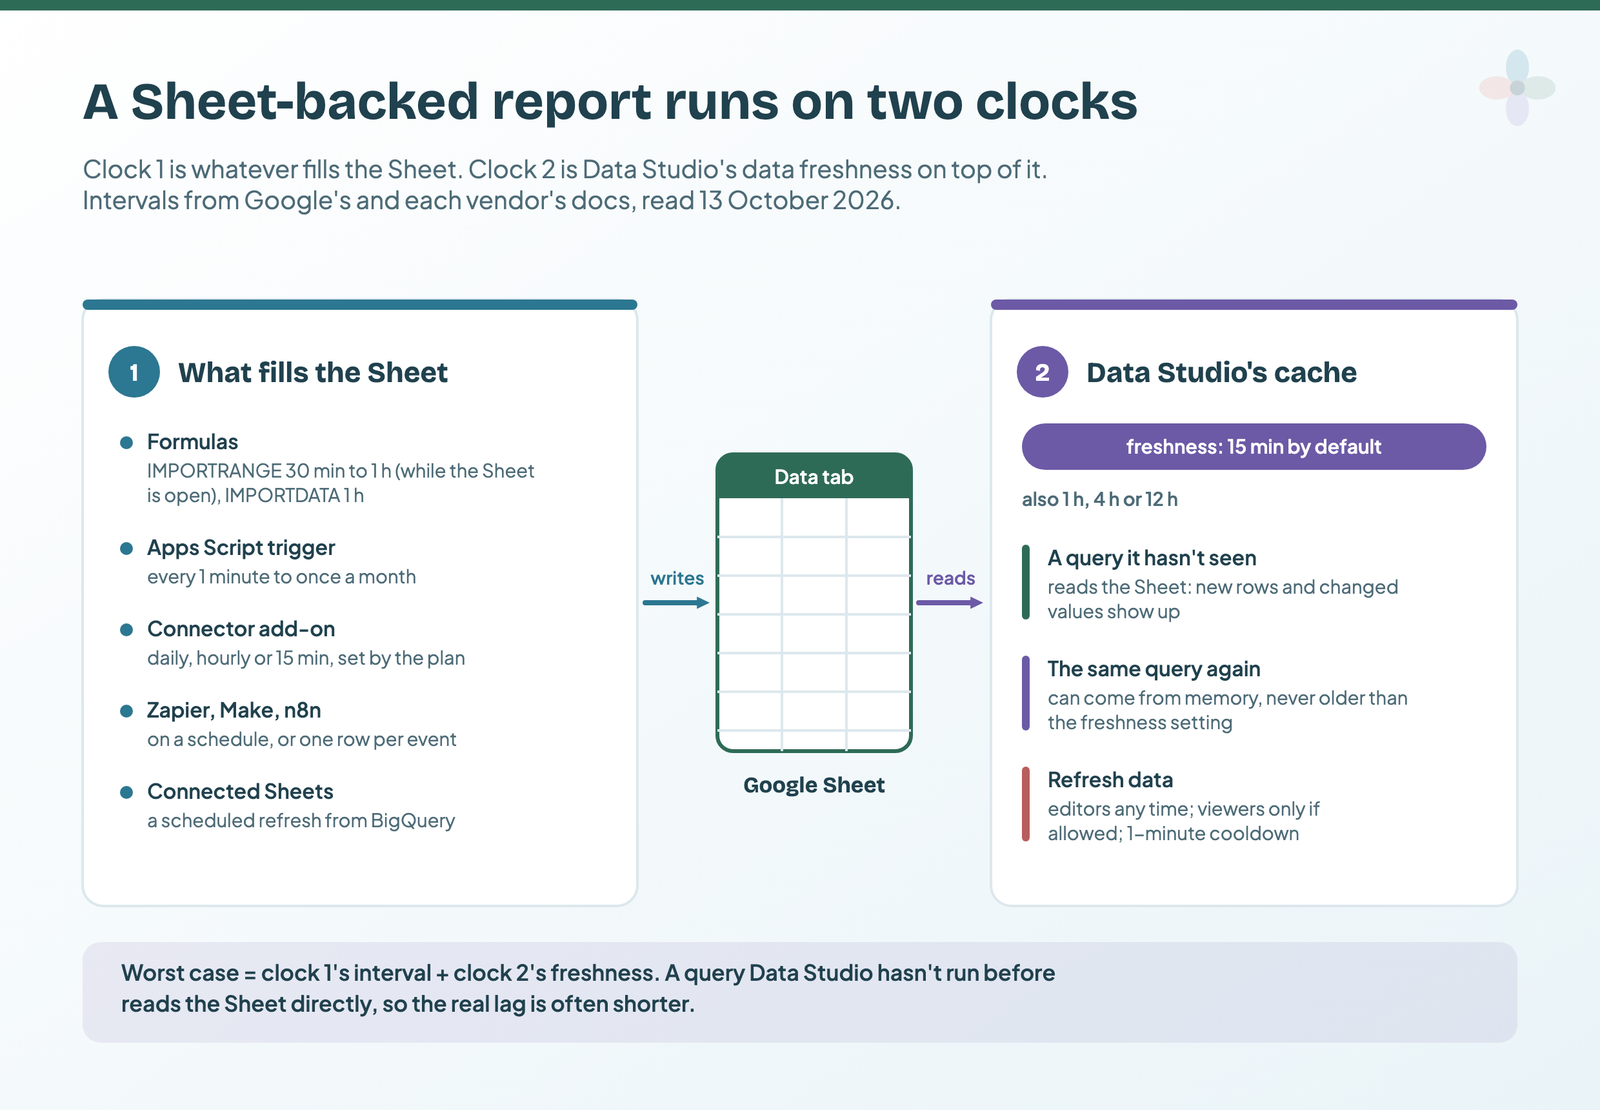
The worst case is the two clocks added together. A few details change who sees what:
- Credentials. With owner’s credentials, every viewer shares one freshness clock; with viewer’s credentials, each viewer has their own (data sources and credentials covers the choice).
- Blends take the shortest freshness of their sources.
- Refresh data. Editors can press it any time (More options → Refresh data), viewers only if allowed, with a one-minute cooldown. The last refresh time sits bottom left.
- Embeds. Embedded viewers can’t refresh; the report updates when the window runs out.
Caching across every connector is in why your Data Studio report shows yesterday’s numbers. For a Sheet, Data Studio is rarely the slow clock. Whatever fills the Sheet usually is.
Five ways to fill a Sheet on a schedule, compared
Formulas and Apps Script are free and built in. Connector add-ons are the practical answer for non-Google ad platforms. Zapier, Make and n8n suit data that arrives one event at a time. Connected Sheets only makes sense if the data already lives in BigQuery.
| Route | Fills from | Cost | Schedule options | Runs as | Worst case with Data Studio’s 15 min | Where it breaks |
|---|---|---|---|---|---|---|
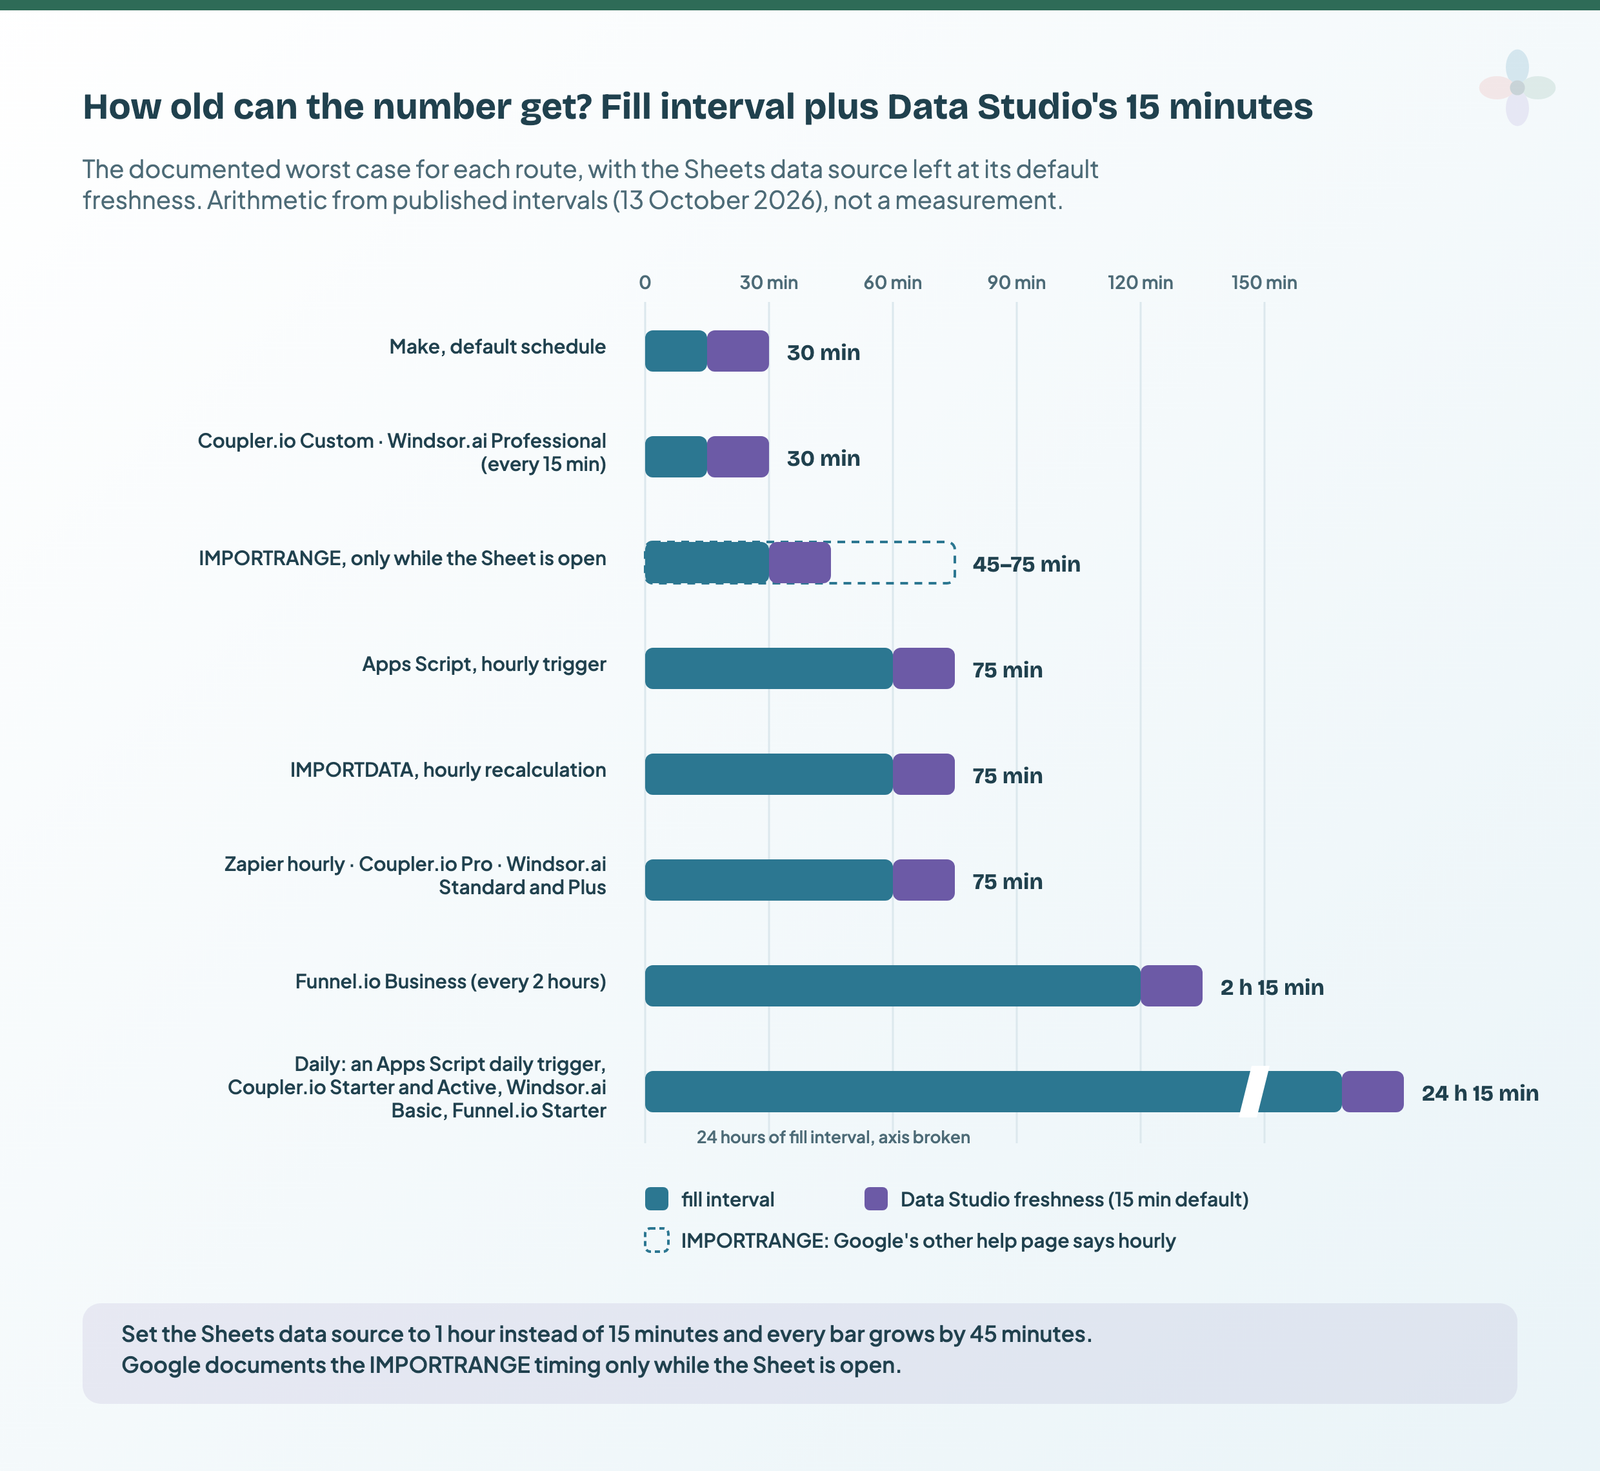
| IMPORTRANGE, IMPORTDATA | Other Sheets; a CSV or TSV URL | Free | None you set: Google recalculates (30 min to 1 h) | The document’s creator (for limits) | IMPORTRANGE 45–75 min, IMPORTDATA 75 min; Google describes IMPORTRANGE updating while the Sheet is open | Nobody opens the Sheet; “Loading…” errors |
| Apps Script trigger | Any API or CSV you can reach by URL | Free, within quotas | Every 1 min to once a month | Whoever created the trigger | 75 min hourly; 24 h 15 min daily | Owner leaves; quota; script errors |
| Connector add-on | Ad platforms, CRMs, shops | Paid plans; some free tiers | Set by the plan: daily, hourly, 15 min | Your account’s access | 30 min to 24 h 15 min, by plan | Plan limits on refresh and rows |
| Zapier, Make, n8n | Events (a lead, an order) or a scheduled call | Plan-based | Zapier hourly to monthly; Make 15 min by default; n8n down to seconds or cron | The workflow’s connected account | 30 min (Make default); 75 min (Zapier hourly) | “Update range” steps that overwrite |
| Connected Sheets | BigQuery | BigQuery billing | Scheduled refresh | Whoever set the schedule | Depends on the schedule | Pauses if someone else edits the data source |
Intervals from Google’s Sheets, Apps Script and Connected Sheets help, Zapier’s, Make’s and n8n’s docs, and each vendor’s plan page, read 13 October 2026. “Worst case” is the fill interval plus Data Studio’s default freshness: arithmetic, not a measurement.
Formulas: IMPORTRANGE, IMPORTDATA and a QUERY roll-up
The quickest automation there is needs no code: one Sheet that pulls from others. IMPORTRANGE imports a range from another spreadsheet, IMPORTDATA imports a CSV or TSV from a URL, and QUERY filters and tidies the result. Google itself recommends giving Data Studio a separate worksheet filled by functions like QUERY, which is exactly this.
A common setup, and the answer to a 2024 thread on Google’s forum from someone adding a new Sheet every week: a roster of client Sheets, stacked into one tab.
Tab "Roster":  A = client, B = spreadsheet URL, C = range (e.g. Data!A2:F)

Tab "Rollup", cell A2 (headers typed in row 1):
=QUERY({
  IMPORTRANGE(Roster!B2, Roster!C2);
  IMPORTRANGE(Roster!B3, Roster!C3);
  IMPORTRANGE(Roster!B4, Roster!C4)
}, "select * where Col1 is not null", 0)

Tab "Feed", cell A1 (a published CSV):
=IMPORTDATA("https://example.com/export.csv")
The braces stack the ranges, and QUERY drops the blank rows open-ended ranges drag in. Every source needs the same columns in the same order, and the first import from each asks you to Allow access.
Now the catch. Google describes IMPORTRANGE’s refresh in terms of an open document: it “automatically checks for updates every hour while the document is open”, and reloads when the document is first opened or was opened in the past five minutes. Google’s calculation-settings page (File → Settings → Calculation) gives a different number for the same function: 30 minutes for IMPORTRANGE, an hour for IMPORTDATA.
What neither page says is what happens when nobody has the Sheet open and Data Studio queries it. A user on Reddit (around 2023) reported having to open the Sheet first, let the formulas refresh, then open the report. It’s one person’s report, unconfirmed by Google or by me, but enough that I wouldn’t rely on formulas for a Sheet nobody opens. Use something that writes values: a script or an add-on.
The same roll-up suits an annotations tab several people maintain (adding annotations to Data Studio charts).
Apps Script: pull an API or CSV on a timer, append, don’t overwrite
Apps Script is the JavaScript that lives inside Google Sheets (Extensions → Apps Script), and a time-driven trigger runs a function on a schedule, as often as every minute or as rarely as once a month. It’s the free, unattended route, and it writes values, so nobody needs to open the Sheet.
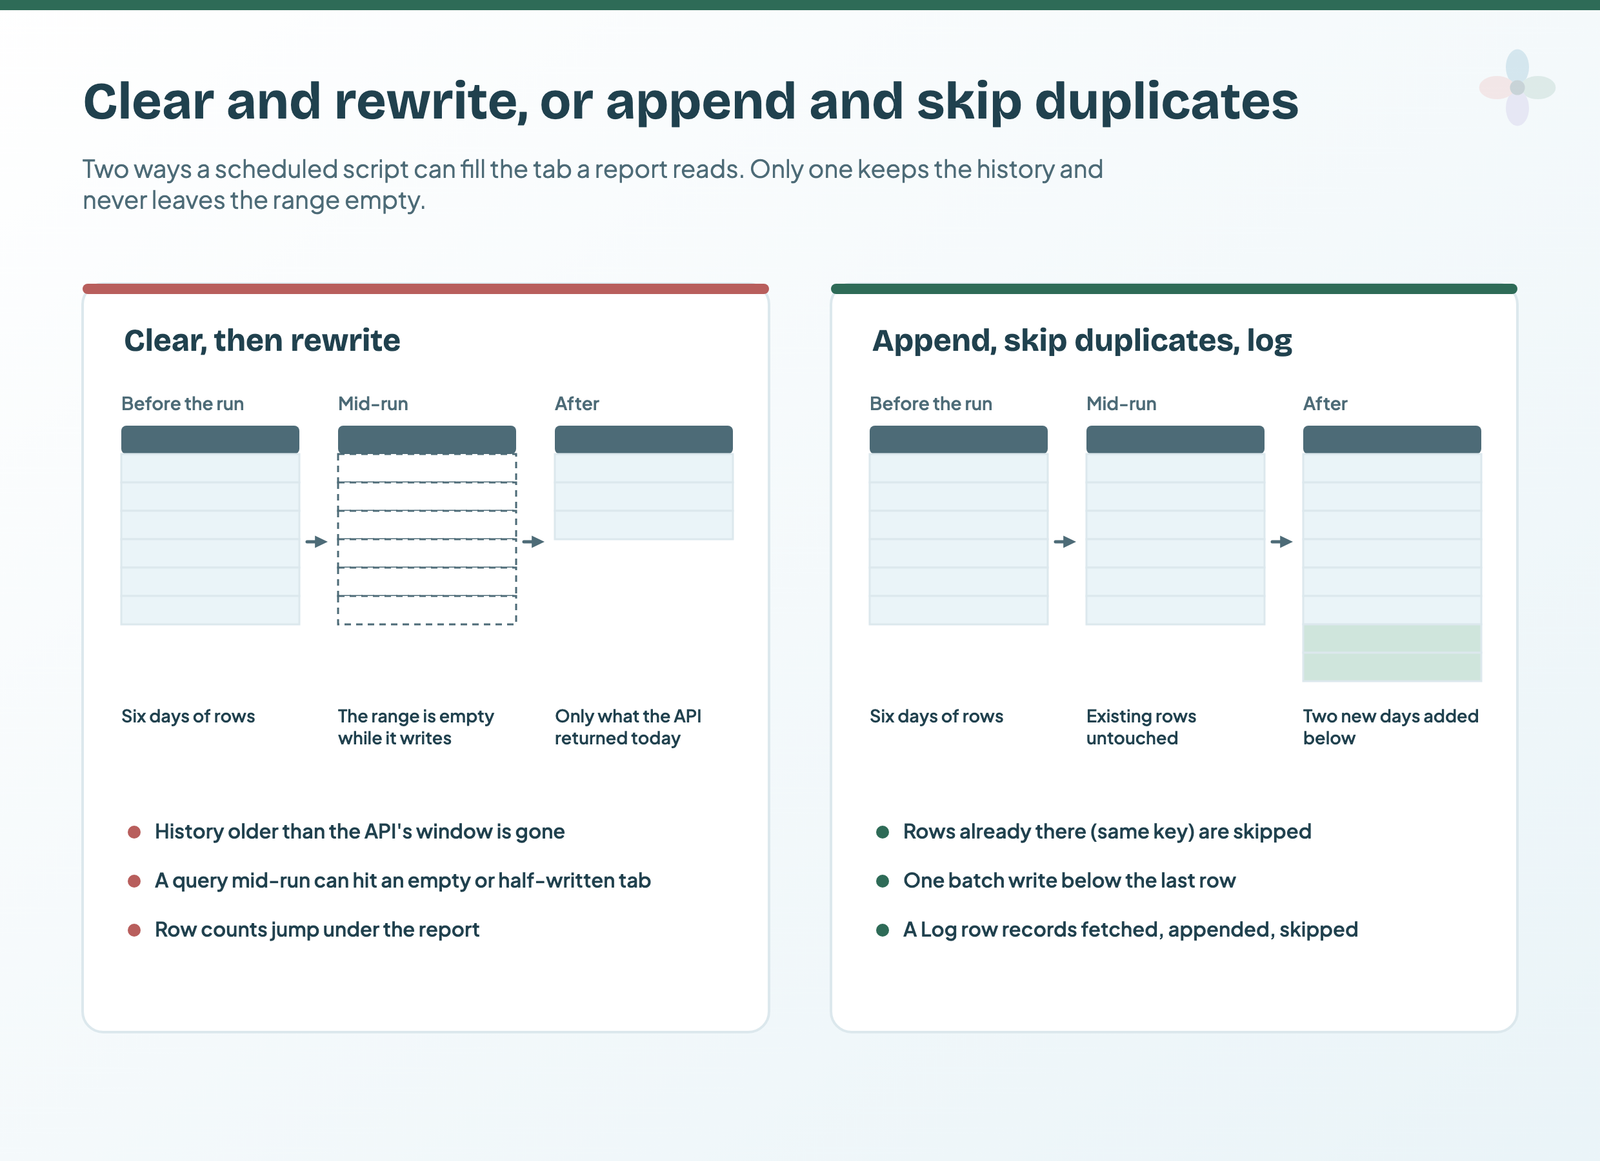
A common pattern in scripts online clears the sheet each run, then writes today’s pull. Simple, with three side effects: history older than the API’s window disappears, the tab is empty mid-run (exactly when a Data Studio query might arrive), and the row count jumps around under the report. Appending is barely more code.
Set it up, step by step
- Copy the starter Sheet (box below), or paste the script into your own Sheet via Extensions → Apps Script.
- Fill in the Config tab: source URL (CSV or JSON), the key columns that make a row unique (say,
date,campaign), and the schedule.
- Run
setup()once and accept the permissions prompt. It writes the Data headers and installs the trigger.
- Or install the trigger by hand: Triggers (left) → Add Trigger →
run, time-driven, hour timer. Or in code:ScriptApp.newTrigger('run').timeBased().everyHours(1).create().
- Check it ran: the editor’s Executions list, and the Log tab (fetched, appended and skipped rows per run).
- Connect the Data tab to Data Studio (how to connect a Sheet) and the Health tab for a “last updated” scorecard.
The core of the script
Written from Google’s docs, not tested here. The full version, with setup(), CSV and JSON parsing, and removeTriggers(), is in the starter Sheet.
function run() {
  var lock = LockService.getScriptLock();
  if (!lock.tryLock(30000)) return;            // a previous run is still going
  var t0 = Date.now();
  try {
    var cfg = readConfig_();                   // from the Config tab
    var records = fetchRecords_(cfg);          // UrlFetchApp + parseCsv / JSON.parse
    var data = SpreadsheetApp.getActive().getSheetByName('Data');
    var headers = data.getRange(1, 1, 1, data.getLastColumn()).getValues()[0];
    var keyIdx = cfg.keys.map(function (k) { return headers.indexOf(k); });

    var seen = {}, n = data.getLastRow() - 1;  // keys already in the tab
    if (n > 0) {                               // read only the key columns
      var cols = keyIdx.map(function (i) { return data.getRange(2, i + 1, n, 1).getValues(); });
      for (var r = 0; r < n; r++) {
        seen[cols.map(function (c) { return keyPart_(c[r][0]); }).join('|')] = true;
      }
    }

    var out = [], skipped = 0, now = new Date();
    records.forEach(function (rec) {
      var row = headers.map(function (h) {
        return h === 'imported_at' ? now : (rec[h] == null ? '' : rec[h]);
      });
      var key = keyIdx.map(function (i) { return keyPart_(row[i]); }).join('|');
      if (seen[key]) { skipped++; return; }
      seen[key] = true;
      out.push(row);
    });

    if (out.length) {                          // one batch write, below the last row
      data.getRange(data.getLastRow() + 1, 1, out.length, headers.length).setValues(out);
    }
    log_(records.length, out.length, skipped, (Date.now() - t0) / 1000, 'OK', '');
  } catch (e) {
    log_(0, 0, 0, (Date.now() - t0) / 1000, 'ERROR', String(e.message || e));
    throw e;                                   // so Apps Script emails the failure
  } finally {
    lock.releaseLock();
  }
}
Four details do the work. muteHttpExceptions: true makes UrlFetchApp.fetch return an error response instead of throwing, so the script checks the status and retries once. LockService stops runs overlapping. One setValues call writes every new row. And re-throwing keeps Apps Script's failure email: a failed trigger shows nothing on screen, but Google emails a "Summary of failures for Apps Script" with a link to fix it.
Two caveats. A trigger runs under the account of whoever created it, invisible to everyone else, so use an account that won't leave. And it isn't to the minute: a 9 AM trigger fires between 9 and 10 AM, then keeps that time.
How far the free quota stretches
| Quota | Free Google account | Google Workspace | What it means for a scheduled import |
|---|---|---|---|
| Script runtime | 6 min per execution | 6 min per execution | Each run must finish in 6 minutes |
| Triggers total runtime | 90 min / day | 6 hr / day | Hourly, free: 3.75 min per run on average. Every 15 min: about 56 s (Workspace: 3.75 min) |
| URL Fetch calls | 20,000 / day | 100,000 / day | Every 5 min on a free account: at most 69 fetches per run |
| Triggers | 20 per user per script | Plenty for one import | |
| URL Fetch response size | 50 MB per call | Page through big exports | |
From Google's Apps Script quotas page, read 13 October 2026. Google says limits can change without notice. Per-run budgets are the daily total divided by runs per day.
For a daily or hourly pull of marketing data, that's plenty. Every minute (everyMinutes(1)) leaves a free account under four seconds per run.
Connector add-ons that write to Sheets on a schedule
For Meta, LinkedIn, TikTok or Shopify data there's no native Google route into a Sheet, so a connector add-on (a vendor's Sheets extension that pulls a platform into a tab on a schedule) is the practical answer.
| Vendor | Sheets refresh by plan | Entry price | Free plan or trial | Workspace add-on rating |
|---|---|---|---|---|
| Coupler.io | Free: manual · Starter and Active: daily · Pro: hourly · Custom: every 15 min | Starter $32/mo billed monthly, $24/mo billed annually | Free plan (100 rows per run); 7-day trial at Pro limits | 4.8 from 277 ratings |
| Windsor.ai | Basic: daily · Standard and Plus: daily or hourly · Professional: also every 15 min | Basic $23/mo billed monthly, $19/mo billed annually | Forever Free: 1 source, 1 account | 4.41 from 27 ratings |
| Supermetrics | Add-on listing: monthly, weekly, daily or hourly refreshes (not tied to plans on the pricing page) | Starter from €39/mo billed yearly (EU view; varies by region). Data Studio and Sheets is a destination extra | Not checked for this post | 4.41 from 950 ratings |
| Catchr | Scheduled export exists; frequency not published | Starter $24/mo billed monthly, or $239/yr | 14-day trial | 3.55 from 11 ratings |
| Porter Metrics | Hourly, daily or weekly | $15 per account/mo billed monthly, $12.50 billed annually, falling with volume | Free plan after a 14-day trial | 3.3 from 10 ratings |
| Funnel.io | Starter: daily · Business and Enterprise: every 2 hours | Starter from €280/mo billed annually | None advertised (demo-led) | — |
Prices and limits from each vendor's pricing page and Google Workspace Marketplace listing, checked 13 October 2026. USD and EUR as each vendor publishes them; no conversion.
Supermetrics' pricing page carried a refresh row on 9 September 2026 saying weekly, daily and hourly refreshes were "(Google Sheets only)"; on 13 October that row is gone. Whether the limits behind it changed, the page doesn't say. And permissions: the Sheets add-ons from Supermetrics, Windsor.ai and Catchr ask to run when you're not present and to see all your spreadsheets. Scheduled refreshes need that, but know it before installing on a shared account.
If Data Studio is the only destination, ask whether you need the Sheet at all: most of these vendors also connect to Data Studio directly. The Sheet earns its place for history you control, joins with your own columns and manual notes. See Data Studio connectors compared, Porter vs Windsor vs Supermetrics and Supermetrics pricing.
Zapier, Make and n8n: when rows should arrive on an event
Workflow tools shine when each new thing (a lead, an order, a form) should become one row. For "pull yesterday's metrics", they're a scheduler around an API call, which Apps Script does free.
| Tool | Schedule options | What counts against the plan | Note |
|---|---|---|---|
| Zapier | Schedule by Zapier: every hour, day, week or month, plus custom intervals | The schedule trigger itself doesn't count toward task usage | Hourly + 15 min freshness = 75 min worst case |
| Make (make.com) | Every 15 minutes by default | The minimum interval depends on the plan | Default + 15 min freshness = 30 min |
| n8n | Seconds, minutes, hours, days, weeks, months, or a cron expression | — | The most flexible schedule of the three |
From Zapier's Schedule help, Make's scheduling help and n8n's Schedule Trigger docs, read 13 October 2026.
The append rule applies here too: map the step to "add a row", not "update a range".
Connected Sheets, and when the Sheet should be BigQuery instead
Connected Sheets runs BigQuery queries from inside a Sheet, on request or on a schedule, and saves the results there. It needs Google Cloud access, BigQuery access and a project with billing (or a BigQuery trial). A scheduled refresh runs as the person who set it up, and it pauses if someone else adds or updates a data source. Extracts are capped at 500,000 rows or 5 million cells.
But if the data is already in BigQuery, Data Studio can read it directly, so the Sheet only earns its place for people who work in the spreadsheet. And if an append-only tab is heading for millions of cells, move the table to BigQuery.
Signs the Sheet has become the wrong layer
- Size: a Sheets file holds up to 20 million cells, so a 20-column tab alone in the file tops out at 1,000,000 rows.
- Many writers on one tab.
- Joins rebuilt in every report.
Sheet rules that keep Data Studio from breaking
Automation changes the Sheet with nobody looking, so every rule here keeps the structure fixed and lets only rows change. Data Studio doesn't detect schema changes: an added, removed, renamed or reordered column needs Refresh fields (edit the data source, Refresh fields bottom left, Apply). On Google's forum in 2024, one edit to one column's formula broke around 30 reports; Google staff's answer: refresh the fields whenever the Sheet changes.
| Rule | What breaks in Data Studio if you ignore it | Google's source |
|---|---|---|
| One header row, frozen | Field names come from the first row (with "Use first row as headers" on); a second header row becomes data | Sheets connector notes |
| One type per column; dates with day, month and year | Mixed columns get the wrong type; text dates don't work with date ranges | Connector notes; Sheets data source tutorial |
| Values, not formula errors | A #N/A from a lookup reaches the chart as-is. Wrap lookups in IFERROR (a fix suggested on Google's forum, December 2025) | Connector notes: cells hold data only |
| No merged cells, no totals rows | Merged cells may make data appear incorrectly; totals get summed again | Connector notes; tutorial |
| Append below; never insert, rename or move a column | A renamed field is treated as removed plus new; charts using it show a configuration error until Refresh fields, and it can't be undone | Refresh data source fields |
| Changed a column's type? Reconnect | Refresh fields doesn't detect a changed type | Refresh data source fields |
| A dedicated tab nobody types in | One stray edit is a schema change. Google recommends a separate worksheet for the data Data Studio reads | Sheets data source tutorial |
| The whole tab, or an open-ended range | The connector's optional range (e.g. A1:Z26) ignores rows below it | Connector options |
| Watch the 20 million cells | That's the file limit, for every tab together; an append-only tab grows towards it every run | Google Drive file limits |
From Google's Sheets connector, Refresh data source fields and Drive file limits pages, read 13 October 2026.
Google also says long beats wide: a row per day, not a column per day. The formatting basics are in the connection guide; the starter Sheet has these rules as a checklist.
When the numbers stop updating: what to check, in order
Check the filler first, then the structure, then the cache, then access. Of the eleven threads I read for this piece, four were a Sheet that changed and broke the report, four were a report not showing new data, and two were platform problems Google fixed.
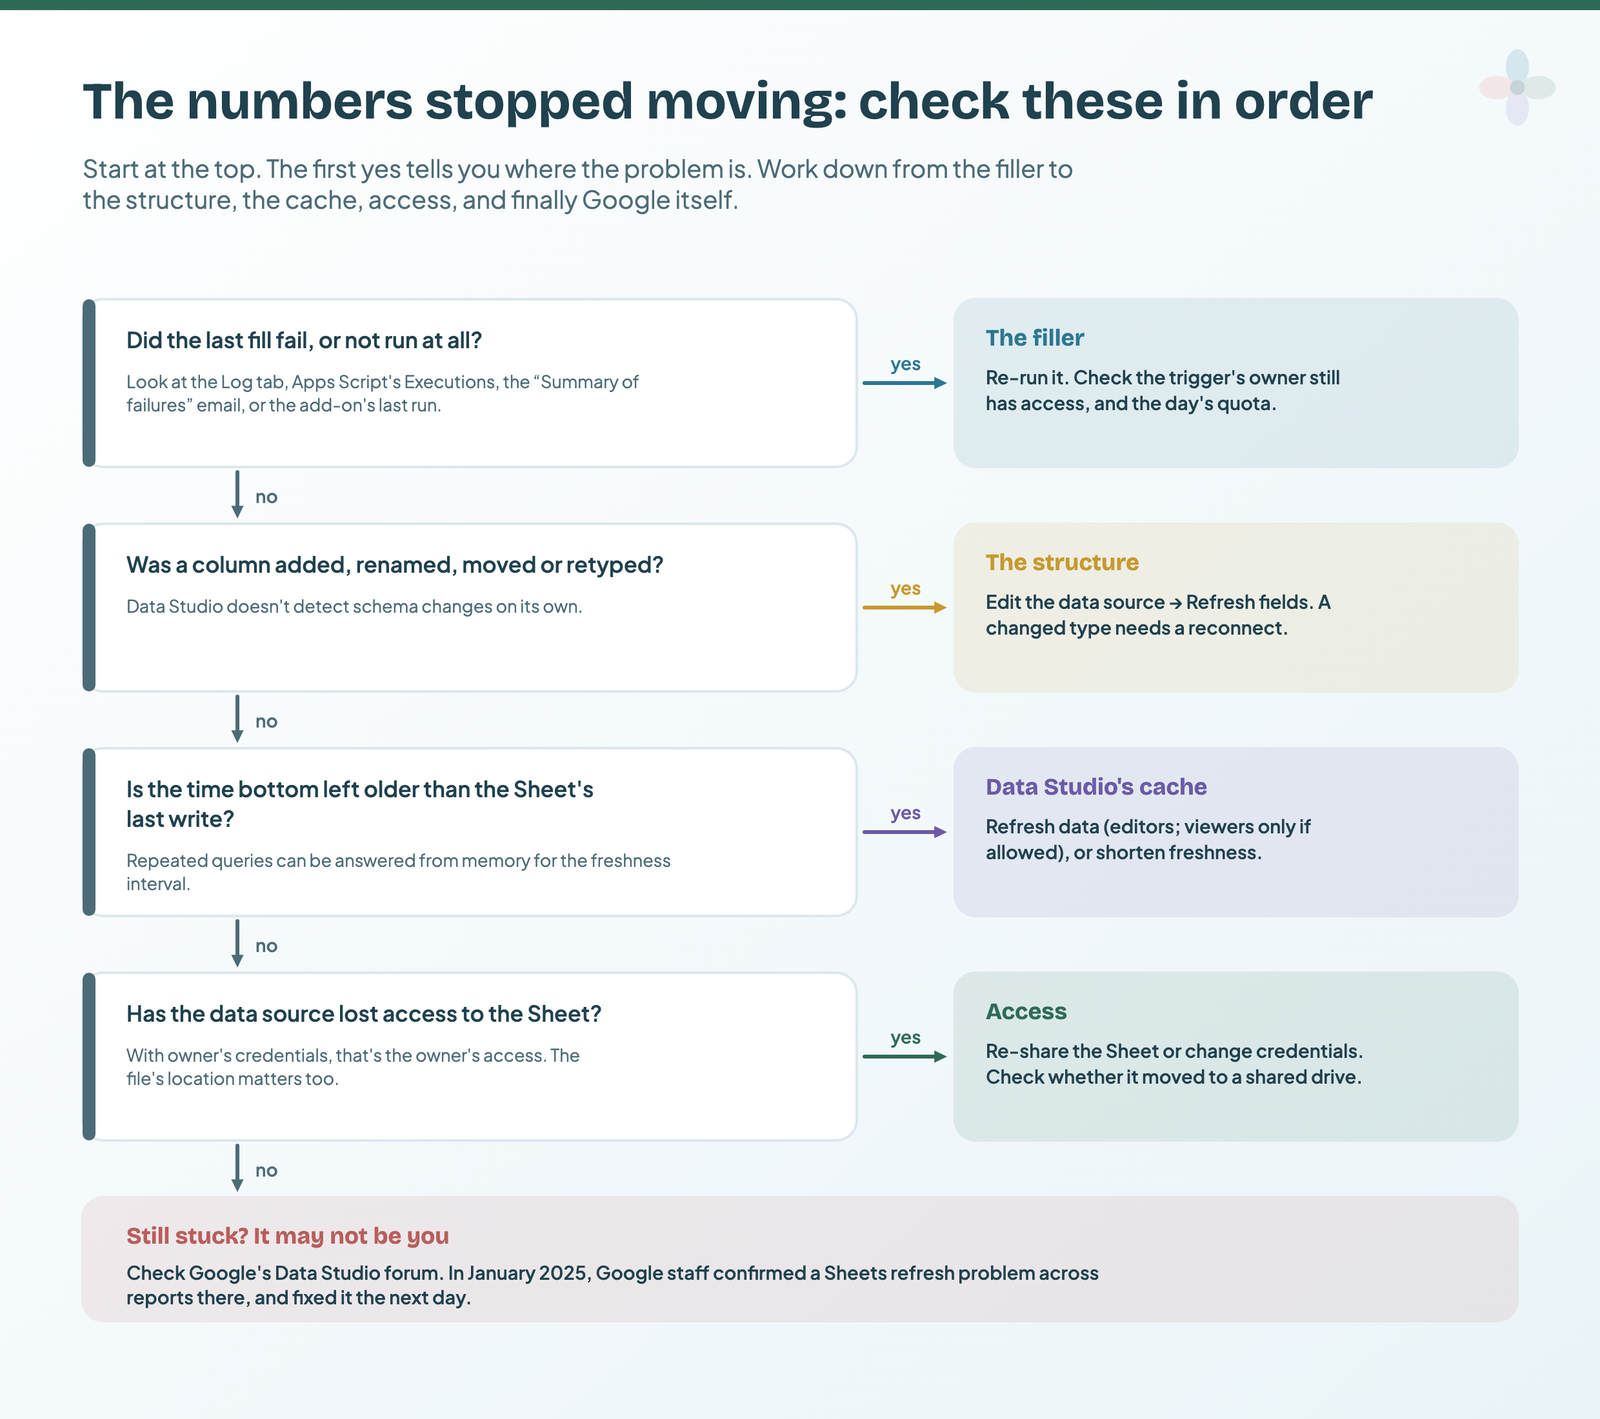
| Symptom | Likely cause | Fix |
|---|---|---|
| The Sheet stopped filling after someone left | The trigger ran under their account | Recreate it from an account that stays (report ownership) |
| Runs start failing later in the day | The daily Apps Script quota is used up | Run less often, or batch the fetches |
| IMPORTRANGE cells say "Loading…" | Too many import functions across the creator's Sheets | Fewer imports, or a script |
| Charts show a configuration error | A column was renamed, moved or deleted | Refresh fields, then fix the charts |
| A metric shows zero or the wrong type | The column's type changed | Reconnect the data source |
| Totals are double what they should be | A totals row in the data | Remove it; let Data Studio do the sums |
| The Sheet won't connect at all | A shared drive (below), or a different Google account | Move it to My Drive; use the same account in Drive and Data Studio |
On that shared-drive row: Google's connector page says "Data Studio does not support accessing files on Team Drive" (the old name for shared drives). The line has no date of its own; the page was updated 9 October 2026.
And sometimes it isn't you. In January 2025, Google staff confirmed on their forum that Sheets data sources were showing wrong data across reports, and fixed it the next day. Look there before rebuilding anything. To spot all this early, add a data health page to client reports; the starter's Health tab is built to feed one. Chapter 24 of my ebook, Data Storytelling in Data Studio, covers how a health page carries a report's caveats, and how to show the reader how old a number is.
Where to go next
- Connecting Google Sheets to Data Studio
- Data freshness, caching and refresh in Data Studio
- Automated client reporting in Data Studio
- When a direct connector beats the Sheet
- Annotations: the other job a Sheet does well
Frequently asked questions
How often does Data Studio refresh Google Sheets data?
A query Data Studio hasn't run before reads the Sheet. Repeated queries can come from memory for up to 15 minutes by default, adjustable to 1, 4 or 12 hours.
Do IMPORTRANGE formulas update if nobody opens the sheet?
Google documents updates while the file is open, not when it's closed. For unattended Sheets, use Apps Script or an add-on, which write values.
Why did my report break after I edited the Sheet?
A column was added, renamed or moved. Edit the data source and click Refresh fields.
How many rows can a Sheet hold for Data Studio?
The file limit is 20 million cells or 100 MB. Google documents no separate row limit for the Sheets connector.
Do I need a paid connector to automate a Sheet?
Not for Google data or any API or CSV you can reach by URL. For Meta, LinkedIn, TikTok and similar platforms, in practice, yes.