
When a Data Studio report shows yesterday’s numbers, it’s usually one of two things: Data Studio is serving a cached answer (up to 12 hours old on Google’s analytics and ad connectors by default), or the platform hasn’t finished processing the data yet. GA4 typically has yesterday’s full data in its reports by mid-afternoon in the property’s time zone, and Search Console runs two to three days behind.
Pressing Refresh fixes the first and does nothing for the second. This covers:
- the four clocks behind every number, and a two-minute check for which one is behind
- how late each Google source runs, and the freshness options for every connector
- how the cache and credentials work, and who can press Refresh data
- extracts, connector vendors, and fixes by symptom
Everything here comes from Google’s own documentation (read 13 October 2026), its release notes, Google’s Data Studio forum, and each connector vendor’s docs. I haven’t tested Pro auto refresh or BigQuery for this piece; where those come up, I’m quoting Google. (Data Studio is the product Google called Looker Studio until April 2026.)
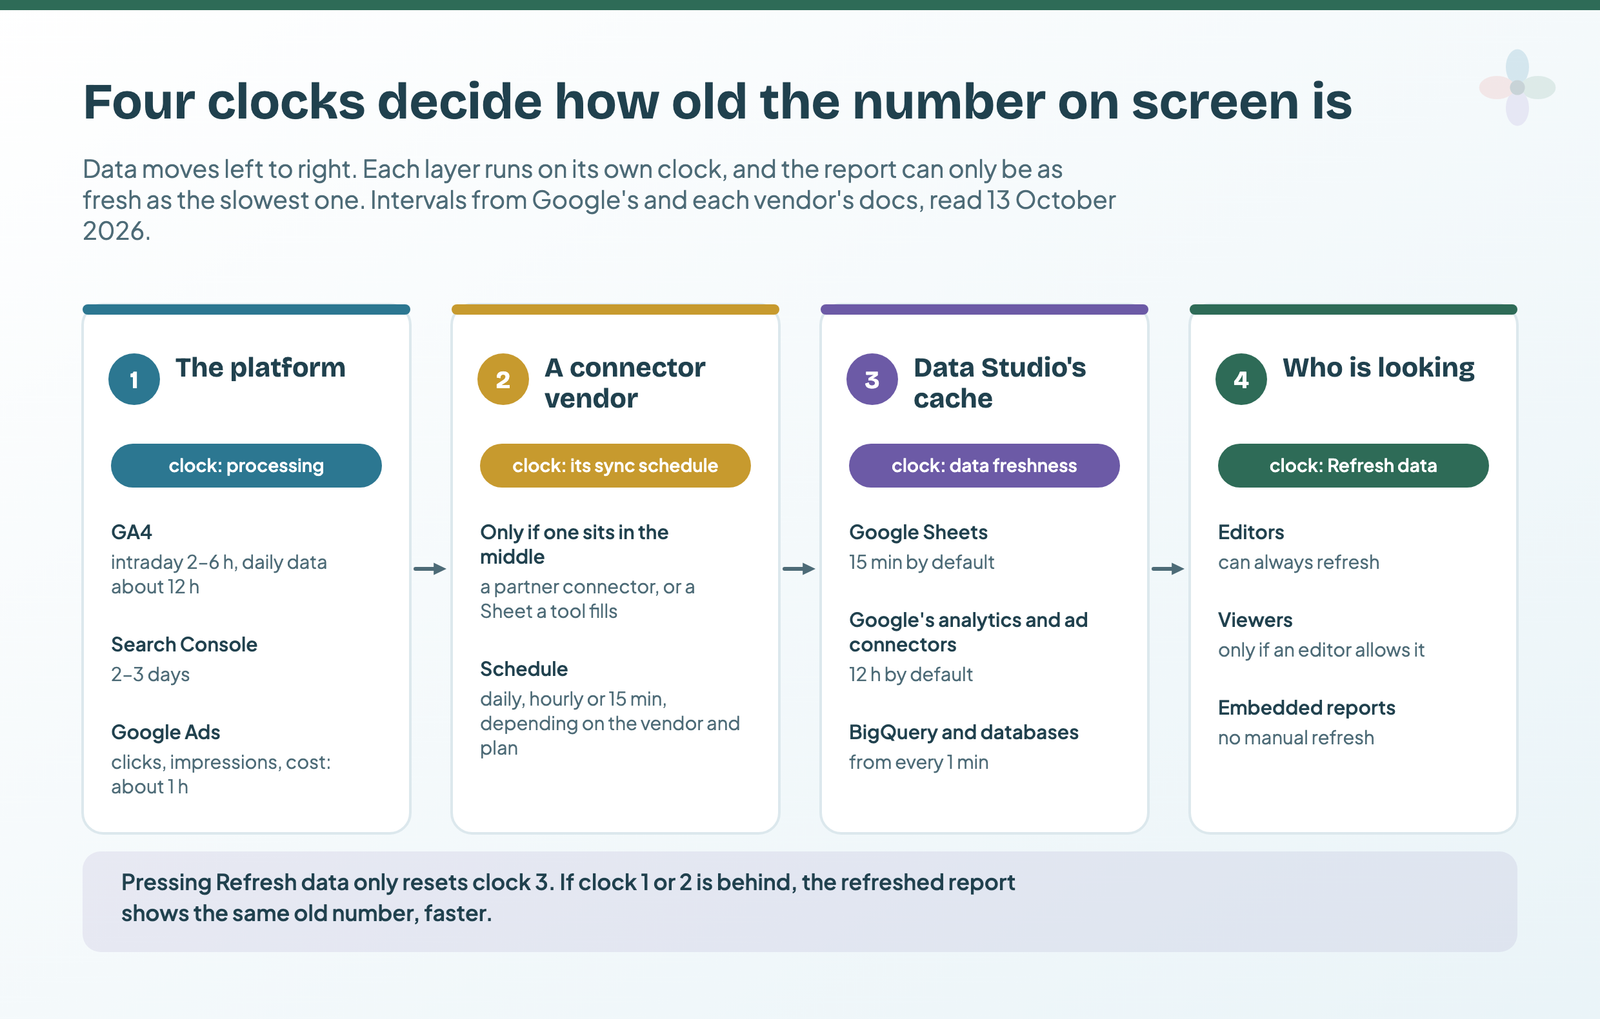
Four clocks decide how old your numbers are
A number in a report passes through up to four layers, and each runs on its own clock:
- The platform’s processing. GA4, Search Console and Google Ads all take time to finish a day.
- A connector vendor’s sync, if one sits in the middle: a partner connector, or a Google Sheet that a tool fills on a schedule.
- Data Studio’s cache. The data freshness setting on each data source decides how long Data Studio may answer from memory before asking the source again.
- Who is looking. Whether the person in front of the report is allowed to refresh it.
The number is only as fresh as the slowest clock. (A data source, if the term is new, is the connection between a report and its data, with its own settings.)
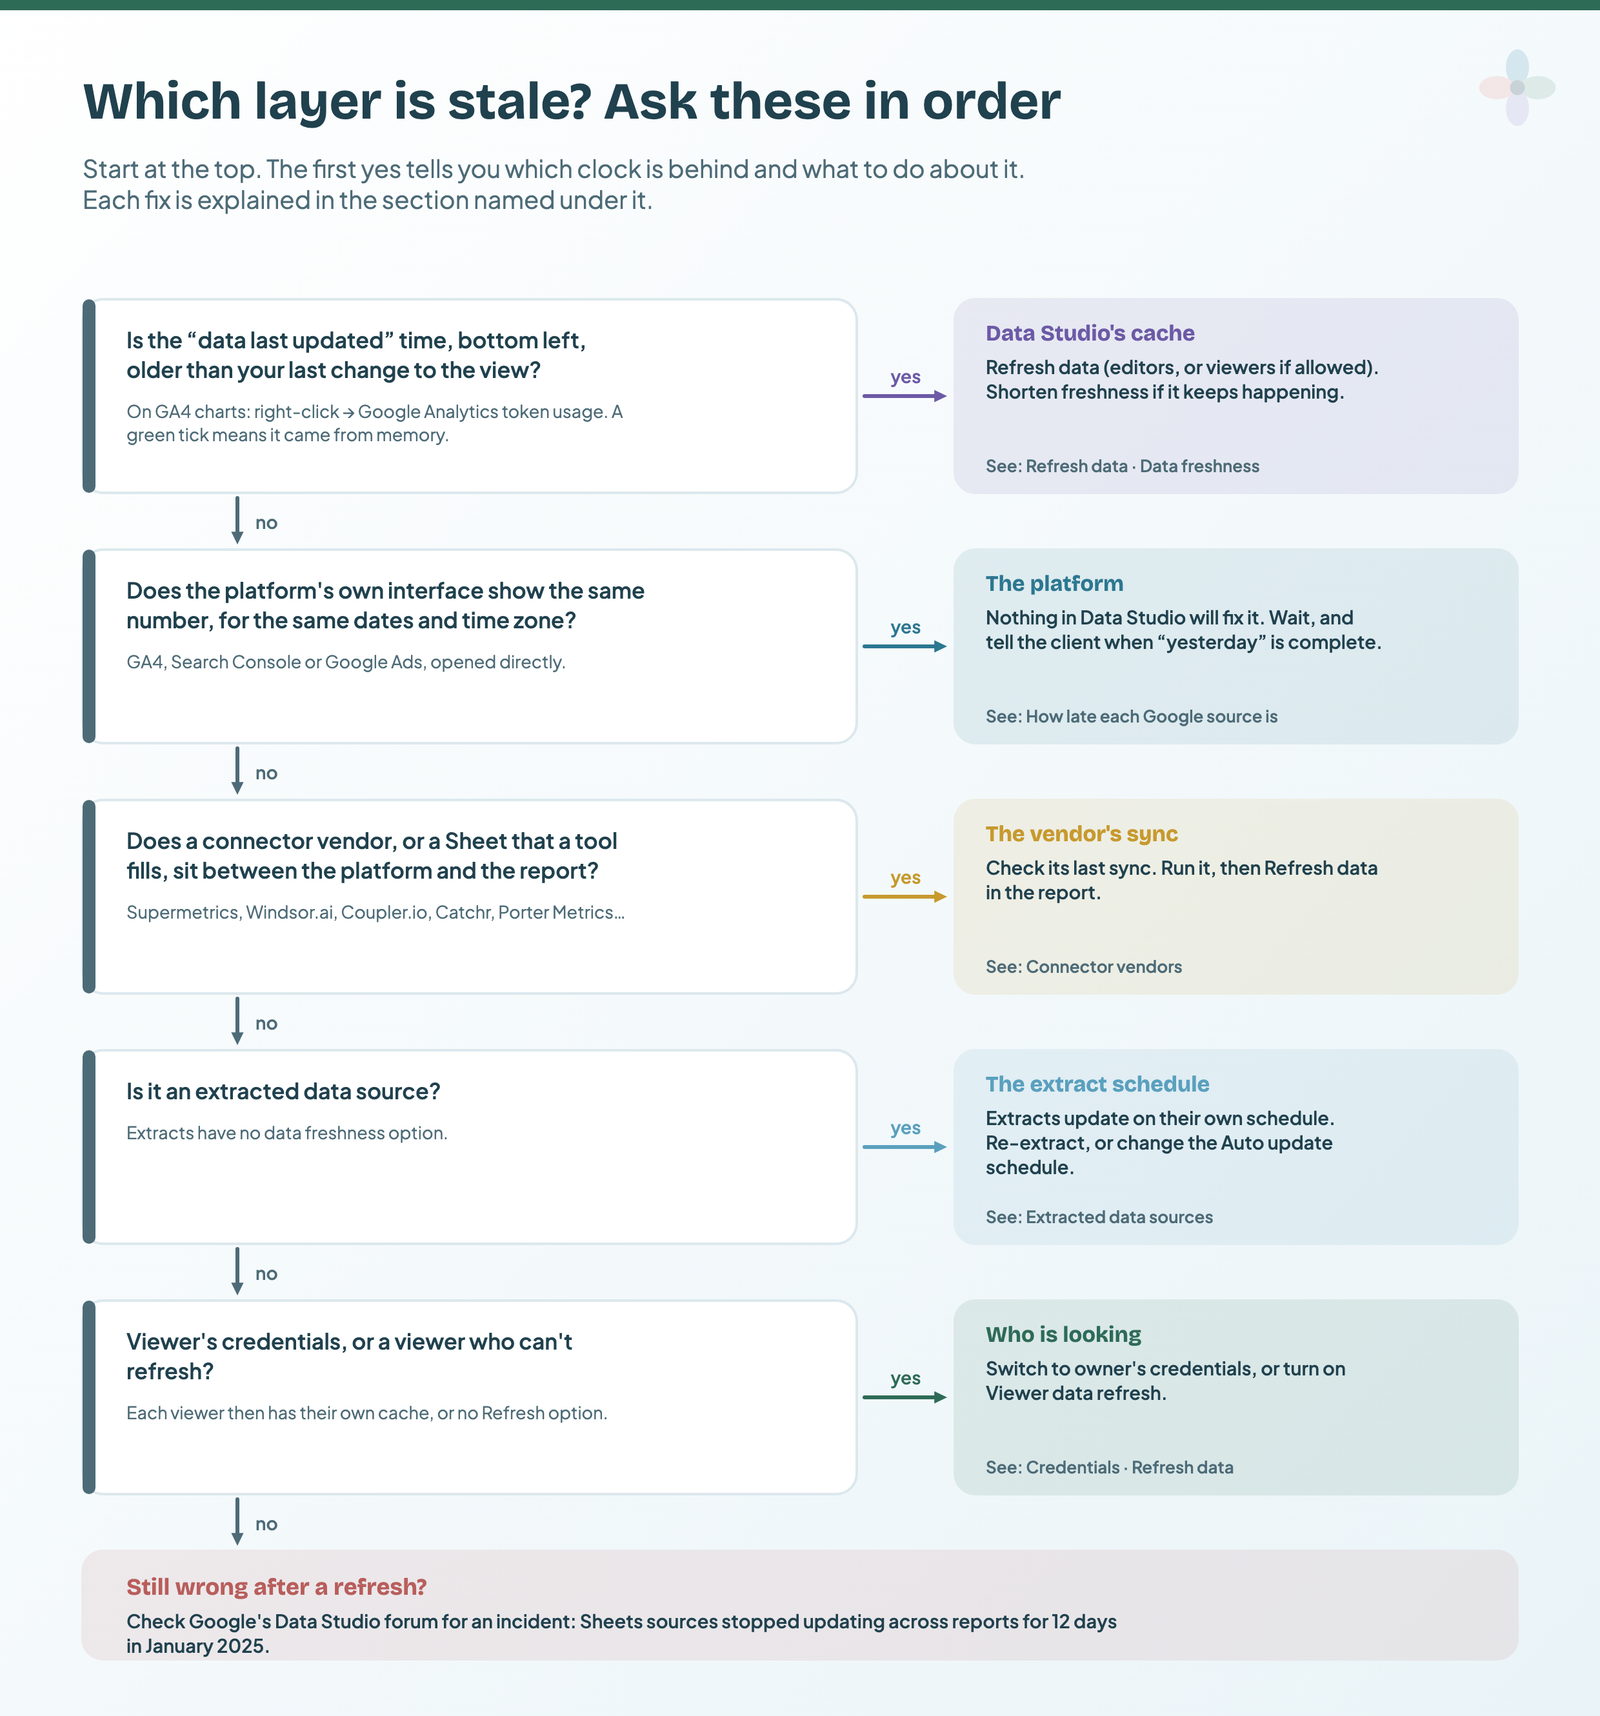
Which layer is stale? A two-minute check
Work through these in order. The first “yes” is your layer.
- Read the time bottom left of the report. That’s when the data was last refreshed. If it’s earlier than your last change to the view (a new date range, a filter), every chart on the page is being served from memory.
- On a GA4 chart, ask it directly. In edit mode, right-click the chart and choose Google Analytics token usage. A green tick means the chart loaded from memory and spent no quota; a red X means it queried GA4.
- Open the platform itself for the same date range and time zone. If GA4 or Search Console shows the same number, the source is behind, not Data Studio.
- Check the data source: its data freshness setting and its credentials.
- For partner connectors, check the vendor’s last sync.
- Still wrong after a refresh? Check Google’s forum for an incident. In January 2025, Sheets data sources stopped updating across reports for twelve days until Google fixed it (the thread).
It’s often GA4, not Data Studio: how late each Google source is
Each Google source finishes a day on its own timetable, and no setting in Data Studio changes it.
| Source | Fresh in | Yesterday typically complete by | Late-arriving data |
|---|---|---|---|
| GA4 (standard property) | Intraday data 2–6 h; daily data about 12 h | Explore about 11:30, BigQuery daily export about 12:00, Reports about 15:30, in the property’s time zone | Some events up to 7 days late; key-event attribution can change for 12 days |
| Search Console | 2–3 days | Two to three days later; days are labelled in California time | — |
| Google Ads | Clicks, impressions, cost: about 1 h | Non-last-click conversions and search terms: the next day. Search impression share: once a day (Sunday’s is ready 16:00 Wednesday, Pacific time). Search click share: 3 days | Late conversions and invalid-traffic adjustments can change past days |
From GA4’s data freshness page, Search Console’s data page and Google Ads’ data freshness page, read 13 October 2026. Google says the GA4 times are typical, not a guarantee.
GA4 has a second trap: while only intraday data exists, traffic-source dimensions can have gaps, more rows fall into “(other)”, and numbers can change once the daily data lands. A Monday-morning report showing Sunday isn’t wrong, exactly. It’s provisional. Chapter 24 of my ebook, Data Storytelling in Data Studio, covers saying so on the page, with a “data to” stamp whose date comes from the data itself.
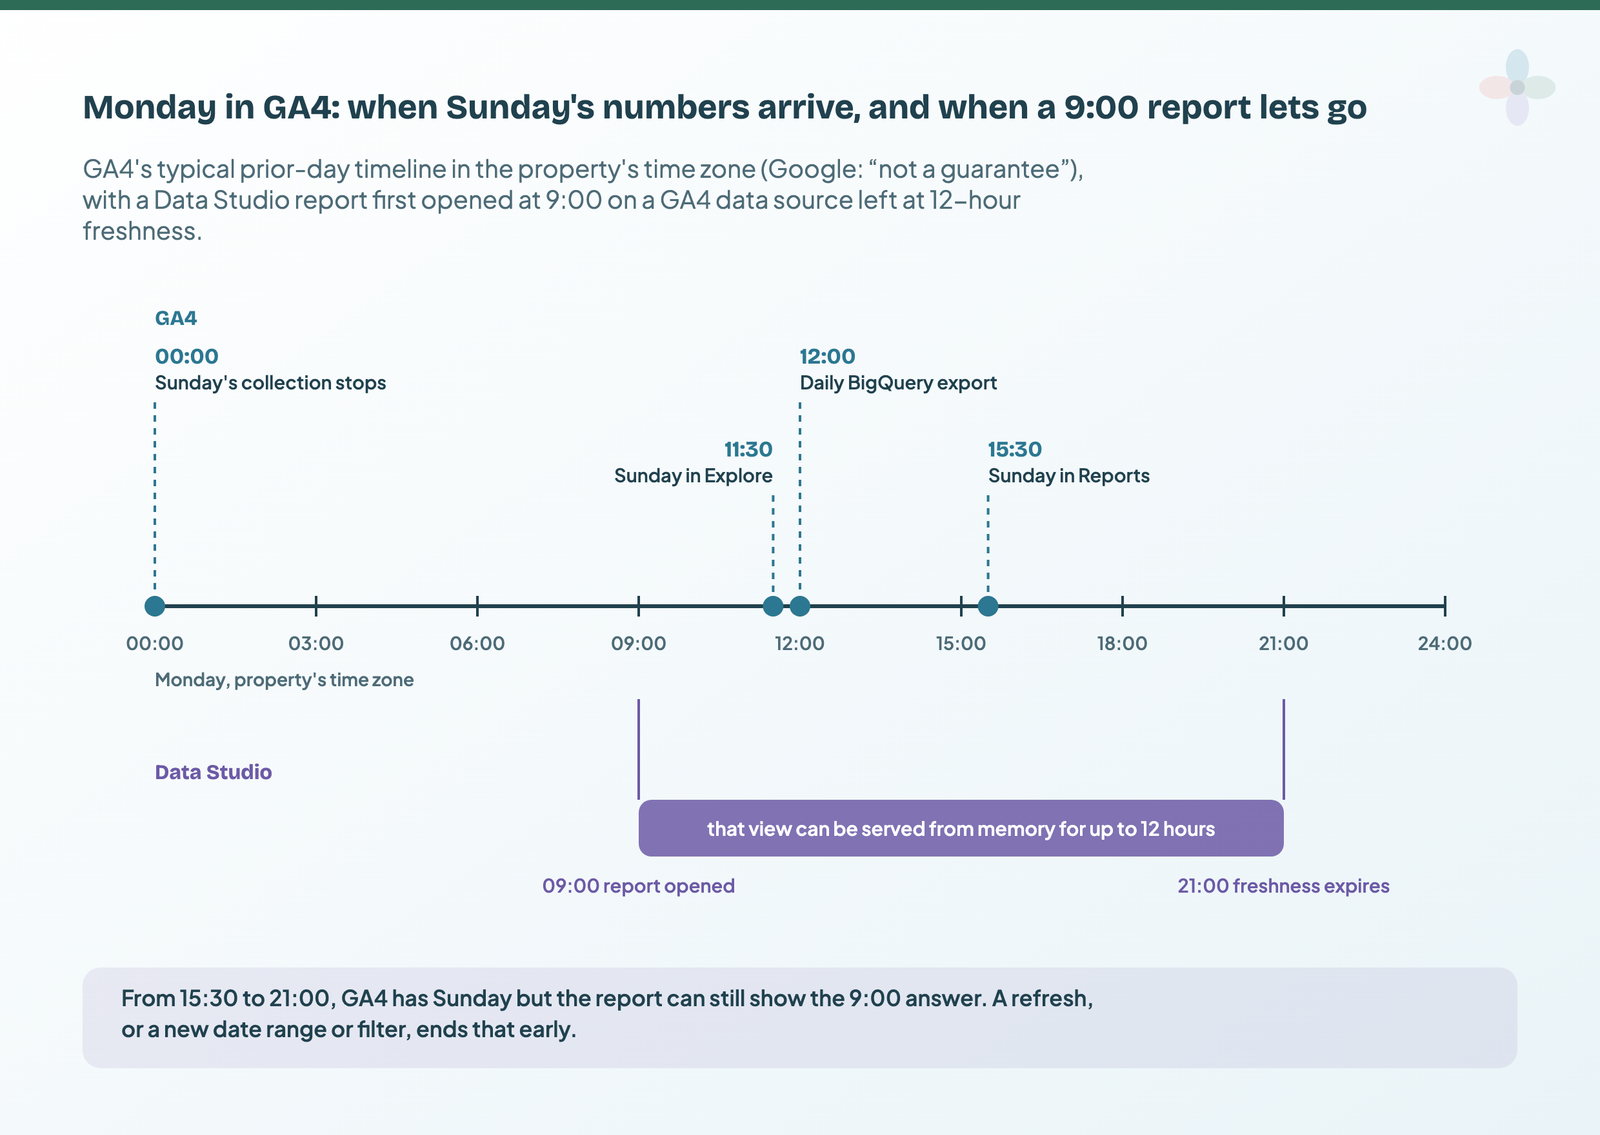
Now add the cache. Say a report on a GA4 data source left at 12 hours is first opened at 9:00 on Monday. That view can be served from memory until 21:00, though GA4’s Reports have Sunday from about 15:30, unless a refresh or a new date range ends it sooner. (Setting up the connection: how to connect GA4 to Data Studio.)
Search Console is slower. On a Wednesday, the latest complete day is typically Sunday or Monday, so the last day or two of a “last 7 days” chart are missing or incomplete, and the line looks like it dips. Tell the client once, in the report’s notes; the Search Console connection guide covers the rest of the set-up.
In Google Ads, spend and clicks are close to live; conversions and share metrics settle over the following days (connecting Google Ads).
Data freshness: the default and the options for every connector
Data freshness is how long Data Studio may answer a chart from memory before it asks the source again. Most data source types have the setting; extracted data sources don’t. To change it: edit the data source, click Data freshness, choose an option under Check for fresh data, then click Set Data Freshness.
| Connector | Options | Default | Can you change it? |
|---|---|---|---|
| Google Analytics (GA4) | Every 1 h, 4 h or 12 h, per Google’s table | 12 h | Google’s docs disagree (below). Plan on 12 h |
| Search Console, Google Ads, other Google ad and measurement products | Every 12 h | 12 h | No |
| Google Sheets | Every 15 min, 1 h, 4 h or 12 h | 15 min | Yes |
| BigQuery, Redshift, Spanner, Cloud Storage, MySQL, PostgreSQL, MS SQL Server, Cloud SQL for MySQL | Every 1–50 min or 1–12 h | 12 h | Yes |
| Community and partner connectors | Varies | Varies | Depends on the connector |
| Extracted data sources | None | — | No: they run on their own schedule |
From Google’s Manage data freshness page, read 13 October 2026.
About that GA4 row: just above its table, the same page says Google’s marketing and measurement products, Google Analytics included, “refresh every 12 hours. That rate can’t be changed.” Google contradicts itself, so I’d plan on 12 hours and treat a shorter option in your panel as a bonus.
For Google Sheets, Data Studio checks for changed values and new rows on every query that isn’t served from memory. More in connecting Google Sheets to Data Studio.
Blends refresh at their fastest source’s speed
A blend’s freshness is the shortest of its sources. Blend a Sheet (15 minutes) with GA4 (12 hours) and the blend refreshes every 15 minutes. Looker Studio Masterclass describes a trick built on it: blend in a one-row BigQuery table at 1-minute freshness and the whole blend refreshes every minute. The price: every BigQuery query that misses the cache is billed.
How the cache decides what you see
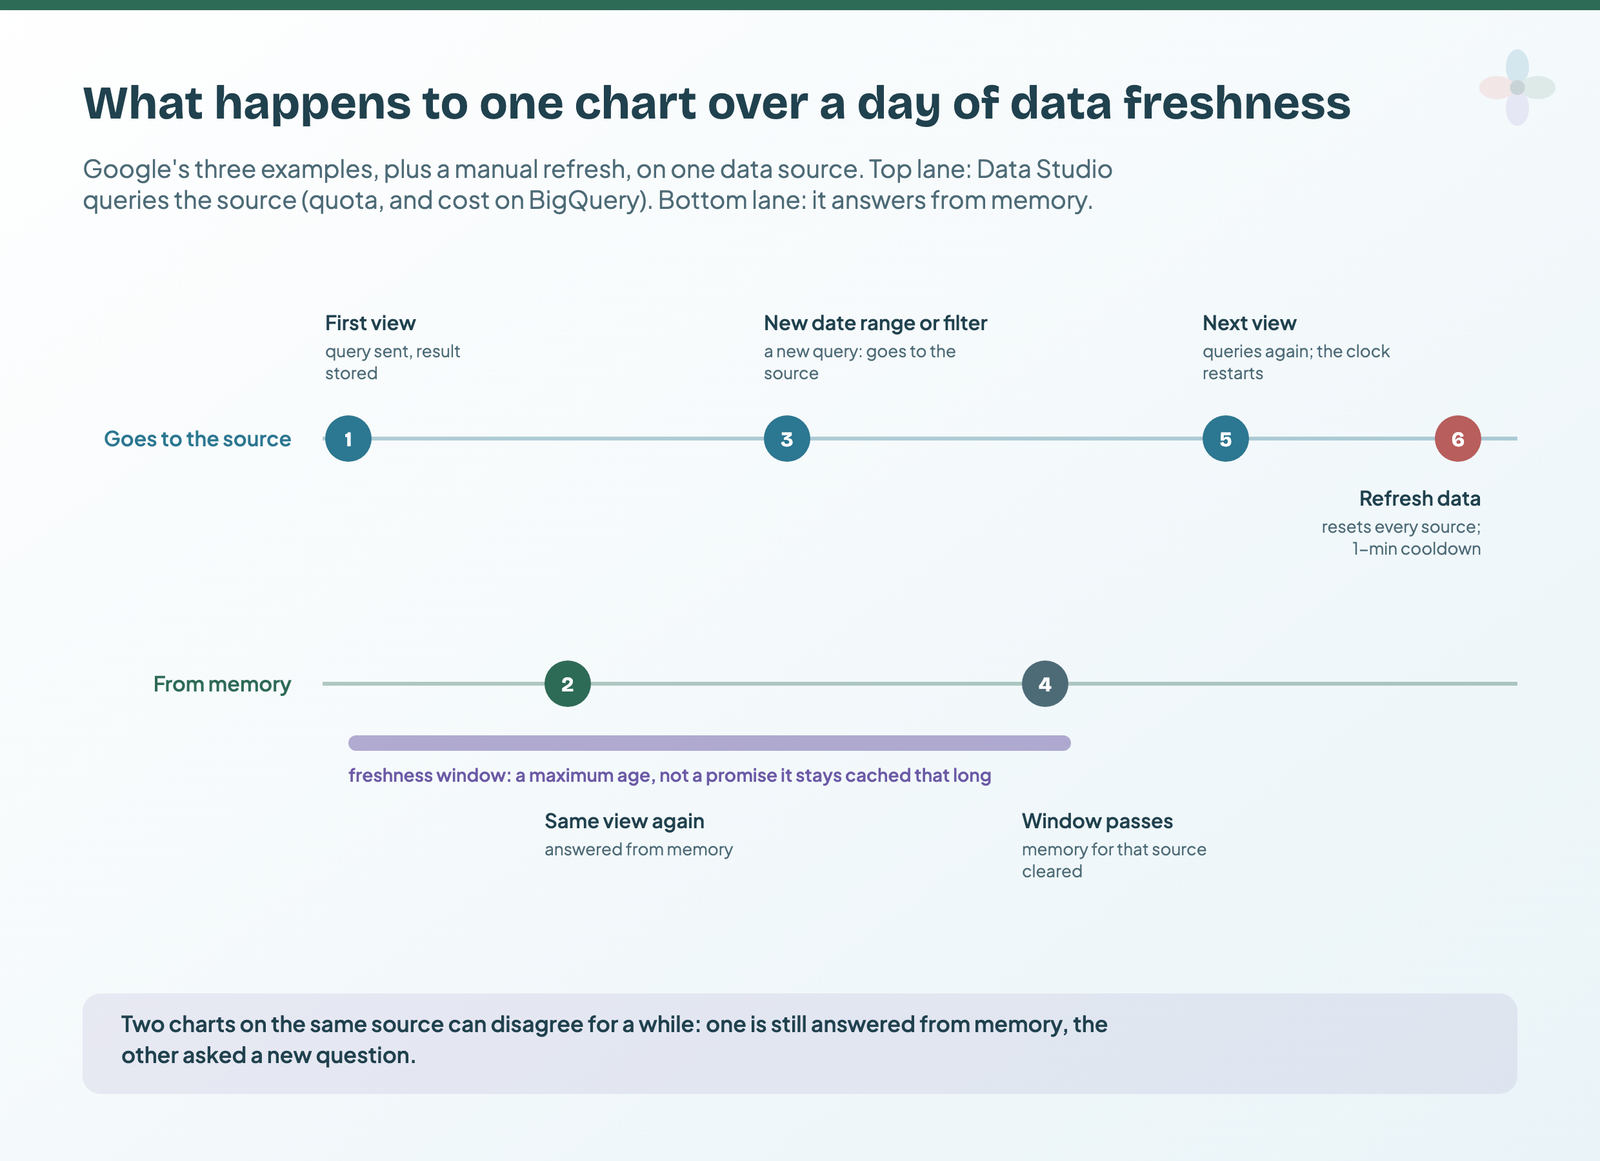
Data Studio keeps each query a chart sends, and its result, in memory. Google’s examples:
- The same view, within the freshness window, comes from memory. Fast, and no quota spent.
- A new date range or filter is a new query, so it goes to the source, even inside the window.
- When the window passes, memory for that source is cleared and the next view queries again.
The window is a maximum age, not a promise. Google’s wording: the data “won’t be older than the specified data freshness setting”, but there’s no guarantee it’s served from memory for the whole interval. That’s why two charts on one source can briefly disagree: one answers from memory, the other asked a new question.
Owner’s or viewer’s credentials: one cache for everyone, or one each
Credentials decide whose access a data source uses to fetch data, and they also decide how the cache is shared:
- Owner’s credentials: every viewer is governed by one freshness setting. If any viewer’s query updates the data, everyone sees the update. Viewers don’t need their own access to the data.
- Viewer’s credentials: each viewer has their own freshness, and their own cache. Each viewer needs access to the underlying data.
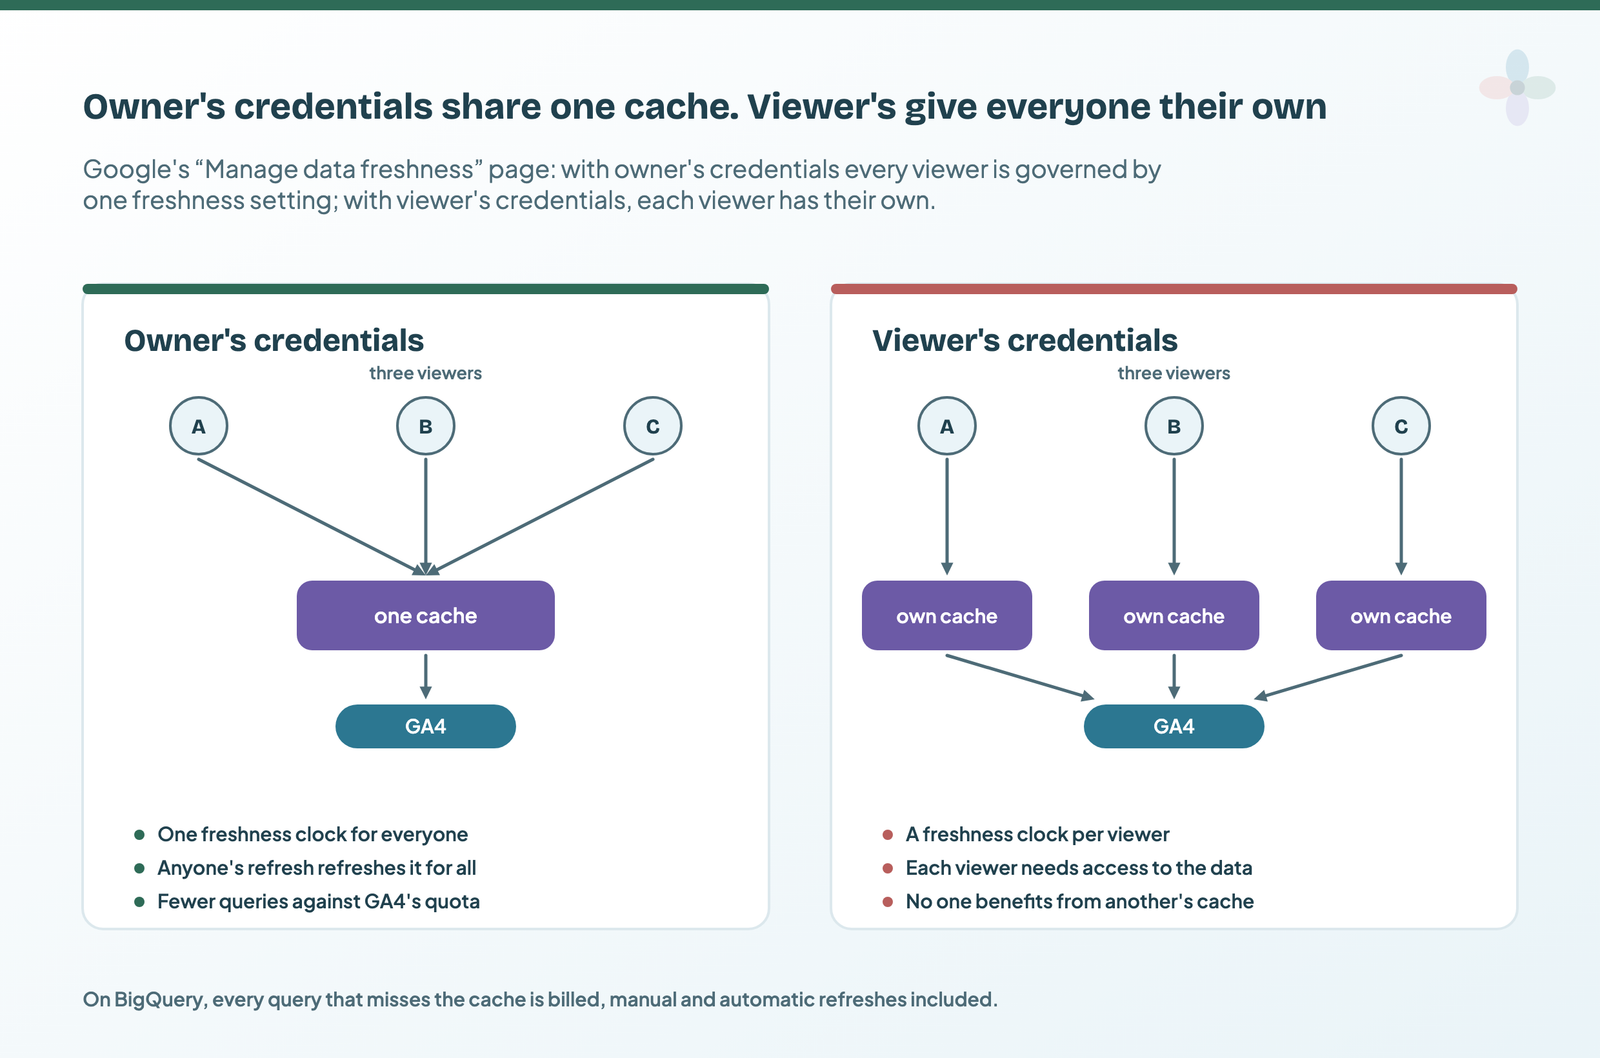
That has a quota side. GA4 data sources are subject to GA4’s API quotas, and Google’s own fix list for “quota exceeded” errors starts with switching to owner’s credentials and using one reusable data source instead of duplicates, because a shared cache sends fewer queries. On BigQuery the same logic is money: every query that misses the cache, manual and automatic refreshes included, is billed. My piece on data sources and credentials covers the trade-offs beyond freshness.
Refresh data: who can press it, and what it actually resets
Refresh data throws away what Data Studio has in memory and queries again. Editors find it under More options (the three dots) → Refresh data. Viewers can refresh only if an editor turns on Viewer data refresh in the report settings, an option Google added on 18 June 2026. Then viewers can right-click a chart (that chart only), use the three-dot menu (the whole report), or click a button an editor has added with the Refresh data action.
| Who | How | What it refreshes | Limits |
|---|---|---|---|
| Editors | More options → Refresh data | Every data source in the report | 1-minute cooldown between refreshes, for every method |
| Viewers | Right-click a chart, the three-dot menu, or a Refresh data button | That chart; the whole report; or what the button is grouped with | Only if Viewer data refresh is on. With Pro, admins can stop editors turning it on |
| Embedded viewers | They can’t | Refreshes when the freshness window expires | No manual refresh in an embed |
| Pro auto refresh | Resource → Manage auto refresh settings | Re-runs the page’s queries on a timer | Pro only; doesn’t refresh the cache |
From Google’s data freshness, report settings, buttons and auto refresh docs, read 13 October 2026.
A refresh resets freshness for every data source in the report, or in the component you refreshed. One forum report (25 August 2026) describes report-level refresh failing silently for viewers while right-clicking a chart worked; if a viewer says Refresh did nothing, try a button or a right-click. For embeds, the options are in my guide to sharing and embedding.
Refresh fields is not a data refresh. It picks up schema changes (a new column in a sheet, a new GA4 custom dimension), it can disable calculated fields and break charts, and it can’t be undone. Google’s own instruction: to see new data, refresh the report data.
Pro auto refresh keeps a screen up to date, not the data fresher
Auto refresh is a Data Studio Pro feature: a Pro report, edit rights, off by default, set from Resource → Manage auto refresh settings at intervals from every 5 minutes to once a day. It’s for a dashboard left open on an office screen. It doesn’t touch freshness: fire it more often than the data source refreshes and you get the cached result, so a 5-minute auto refresh on GA4 still shows numbers up to 12 hours old. (What else Pro adds: Data Studio free vs Pro.)
Extracted data sources run on their own schedule
An extract is a static snapshot of a data source, built for speed: up to 100 MB, and rows past 750,000 are truncated. It has no freshness setting at all. It updates only on its Auto update schedule, or when the owner edits the connection and re-extracts. Fast to load, and exactly as stale as its last run; my Extract Data guide covers setting it up and fixing failed extracts.
Connector vendors add a clock of their own
Each vendor documents a different model. None of them can make Data Studio’s own cache shorter.
| Vendor | How Data Studio gets the data | Vendor-side cache or schedule | What a bigger plan changes |
|---|---|---|---|
| Supermetrics | Fetched when the report loads, is refreshed, or is edited | Its docs: Data Studio’s freshness setting “has no effect” on its connectors | Sources, accounts and users, not freshness |
| Windsor.ai | Query results cached for 6 hours | Scheduled refreshes bypass the cache; Clear Cache allowed once every 2 hours | Sync frequency: daily on Basic, up to hourly on Standard and Plus, up to every 15 min on Professional |
| Coupler.io | Its flow runs, then Data Studio pulls on its own cycle (Coupler’s docs say every 12 hours by default) | The flow’s schedule | Manual on Free, daily on Starter and Active, hourly on Pro, every 15 min on Custom |
| Catchr | A live query when the report opens or refreshes | No Catchr-side schedule for Data Studio | Not published |
| Porter Metrics | Live API data, with optional storage “for extra speed and stability” | Its Sheets add-on schedules hourly, daily or weekly | Not published for Data Studio |
From each vendor’s own documentation and pricing page, read 13 October 2026.
In practice: with Coupler.io, run the flow, then press Refresh data, or you’ll wait for both cycles. With Windsor.ai, a scheduled refresh gets past its 6-hour cache. A bigger Supermetrics plan doesn’t make a report fresher (more in my Supermetrics pricing guide). Any route through Google Sheets stacks the vendor’s schedule on top of Data Studio’s 15-minute default. The connectors comparison and Porter vs Windsor vs Supermetrics cover the rest of each tool.
Fixes, by symptom
| Symptom | Likely layer | Fix |
|---|---|---|
| Old time bottom left; GA4 token usage shows green ticks | Data Studio’s cache | Refresh data; shorten freshness where the connector allows |
| Report matches GA4, but yesterday looks low | GA4 processing | Wait until mid-afternoon (property time zone); tell the client yesterday is provisional |
| Last 2–3 days dip in Search Console charts | Search Console lag | Nothing to fix; end the default date range three days ago, or add a note |
| Refresh changed nothing on a partner connector | Vendor sync | Check the vendor’s last sync or run, then refresh |
| Report on an extract is a day behind | Extract schedule | Re-extract, or change Auto update |
| Different people see different numbers | Viewer’s credentials | Owner’s credentials and one reusable data source |
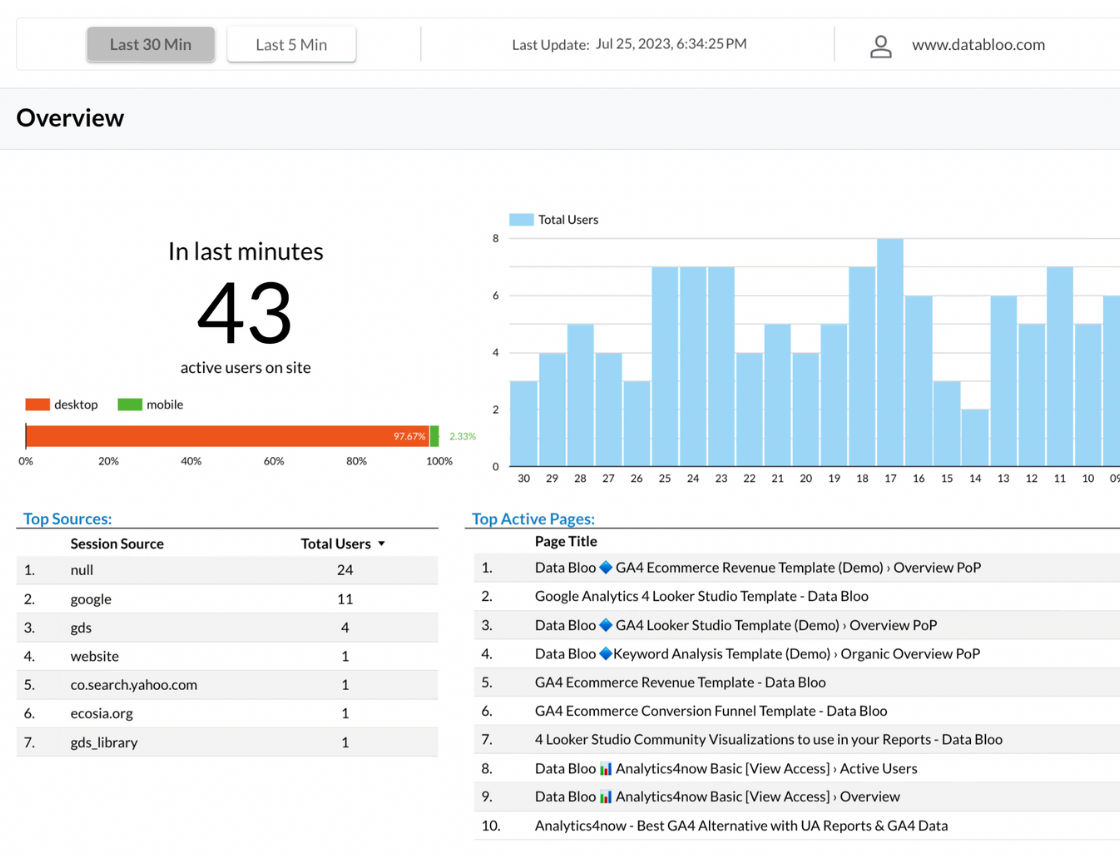
When a client needs minutes-fresh GA4 data, the route is GA4’s BigQuery streaming export, which Google describes as “near realtime data (within minutes)” at an extra $0.05 per GB (about 600,000 events per GB), with a BigQuery data source set to a short freshness, down to every minute. Every refresh is a billed query. A real-time template shows the shape:
A browser auto-reload extension reloads the page but can’t shorten freshness: the cache rules above still apply.
For reports on a Google Sheet, show when the sheet’s data last changed, not when Data Studio last asked: the kit below includes an Apps Script that writes that time to a tab for a scorecard (written from Google’s docs, not tested here). A whole page of these signals is the subject of adding a data health page to client reports.
Where to go next
- How to connect GA4 to Data Studio
- Connecting Google Sheets to Data Studio
- Data sources, datasets and credentials
- Extract Data: faster reports and fixing failed extracts
- Automated client reporting in Data Studio
- Data Studio connectors compared
Frequently asked questions
How often does Data Studio refresh data?
It depends on the source: Google Sheets every 15 minutes by default, Google’s analytics and ad connectors every 12 hours, BigQuery and databases as often as every minute. Extracts update on their own schedule.
Why doesn’t my Data Studio report match GA4?
A cached answer, GA4 still processing the day, different time zones or date ranges, or key-event attribution still settling. The two-minute check above tells you which.
Can viewers refresh a Data Studio report?
Yes, since June 2026, if an editor turns on Viewer data refresh. Never in an embedded report.
Does upgrading my connector plan make Data Studio fresher?
It can shorten the vendor’s sync, where there is one, but not Data Studio’s cache. For Supermetrics, the freshness setting has no effect at all.
Does auto refresh need Pro?
Yes, and it doesn’t bypass data freshness.
What’s the difference between Refresh data and Refresh fields?
Refresh data fetches new numbers. Refresh fields picks up schema changes, such as a new column.
Some links in this post are affiliate links: if you sign up through one, I may earn a commission at no extra cost to you. How I work with partners.