
To use Conversational Analytics in Data Studio with GA4 data, you build a data agent in BigQuery, not in Data Studio: get GA4 into BigQuery (the free GA4 Data Transfer is the easier start, the raw event export the alternative), point an agent at a clean table, teach it your metric definitions, cap what it can spend, then publish it to Data Studio, where anyone you share it with can ask it questions. You don’t need Data Studio Pro, but you do need a Google Cloud project with billing turned on.
Conversational Analytics is the one AI feature in Data Studio open to every user, but it’s really a BigQuery product with a Data Studio front door. The work, and the bill, sit in getting GA4 into a table an agent can read and teaching it what your marketing words mean. This post covers:
- what you need and what it costs, including the token billing that starts in January
- GA4 into BigQuery, two ways, and the table to give the agent
- building the agent and teaching it your GA4 definitions
- cost guardrails, sharing to Data Studio, and fixing “I can’t see the agent”
- checking its answers, its limits, privacy, and when an MCP route fits better
My evidence: Google’s Data Studio, BigQuery, Cloud Billing and GA4 docs as they read on 14 October 2026, plus Google’s forum and Stack Overflow. I haven’t built a data agent for this post (no billed BigQuery project to test with yet), so the BigQuery screens come from Google’s docs, every SQL block is marked untested, and screenshots follow once I’ve run it. (Data Studio was called Looker Studio until April 2026, so older guides say “Conversational Analytics in Looker Studio”; most show the legacy, Pro-only version that used Sheets.)
What you need before you start, and what it will cost
Google’s overview says the new experience is available to all Data Studio users and doesn’t need Gemini in Data Studio. Only its Code Interpreter still needs Pro with Gemini (what Pro does add). What you do need is on the BigQuery side:
| Thing | Who | Why |
|---|---|---|
| A Google Cloud project with billing enabled | Whoever pays | Google’s agent setup starts with “Verify that billing is enabled” |
| BigQuery, Gemini Data Analytics, Gemini for Google Cloud and Knowledge Catalog APIs | Project admin | The four APIs Google lists |
| GA4 Editor + BigQuery project Owner (export) or BigQuery Admin + GA4 viewer (transfer) | Whoever links GA4 | To create the link or the transfer |
| Data Agent Creator + Data Catalog Viewer | The builder | To create an agent and add tables to it |
| Data Agent User + BigQuery Studio User (or Gemini for Google Cloud User) + Data Studio Asset Viewer | Everyone who chats | To open the agent in Data Studio |
| The project opened once in the Cloud console | Everyone who chats | Data Studio only lists your recent projects |
Why not the free BigQuery sandbox? It has no billing account, and Google’s agent setup asks for billing to be enabled. It also lacks the Data Transfer Service, and its tables expire after 60 days (Google’s sandbox page).
Then the bill. There are three meters, plus storage:
| Meter | Price (USD list) | Free allowance | Billed from |
|---|---|---|---|
| BigQuery queries (every question runs SQL) | $6.25 per TiB scanned, on demand | First 1 TiB a month | Now |
| Agent data tokens (conversations) | $3 per million input tokens, $20 per million output tokens | Free trial through 31 December 2026 | 1 January 2027 |
| Data insights tokens (generated when you add a table) | The same data-token rates | Not stated | 27 October 2026 |
| Storage | BigQuery storage pricing | First 10 GiB a month | Now |
| Streaming GA4 export (optional) | $0.05 per GB | None | Now |
Prices from Google’s BigQuery pricing, data agent pricing and GA4 export pages, checked 14 October 2026; USD list prices.
Google’s pages don’t fully agree. BigQuery’s conversational analytics page mentions only compute pricing, then links to the agent pricing page for the tokens. The data insights date is also in Google’s Knowledge Catalog FAQ, whose own note says the rollout “begins on November 2, 2027”, likely a typo. And Google doesn’t publish how many bytes or tokens a question uses, so there’s no honest per-question price.
Decide whose project pays, the agency’s or the client’s, before you link anything; it’s easier than moving an export later. If you’re still deciding whether BigQuery is worth it at all, extract vs cache vs BigQuery lays out when it is.
Step 1: Get GA4 into BigQuery: the GA4 transfer or the event export
There are two ways in, and they give the agent very different tables.
| GA4 Data Transfer (the easier start) | Raw event export (the alternative) | |
|---|---|---|
| What you get | Report-shaped tables, loaded daily: Traffic acquisition, Events, Landing page, Ecommerce purchases and more | Every raw event, one table a day (events_YYYYMMDD), plus optional streaming |
| History | Backfill “as far back as the data retention policy” allows | From the day you link; no backfill |
| Channel group | Yes: sessionDefaultChannelGroup |
No field for it: you build your own |
| Cost to run | “There is no cost to run a Google Analytics 4 transfer”; storage and queries are billed | Daily export: storage and queries. Streaming: $0.05 per GB |
| Limits | User and session totals may not match GA4; no custom dimensions; one custom report per transfer | 1 million events a day on standard properties; nested and harder to query |
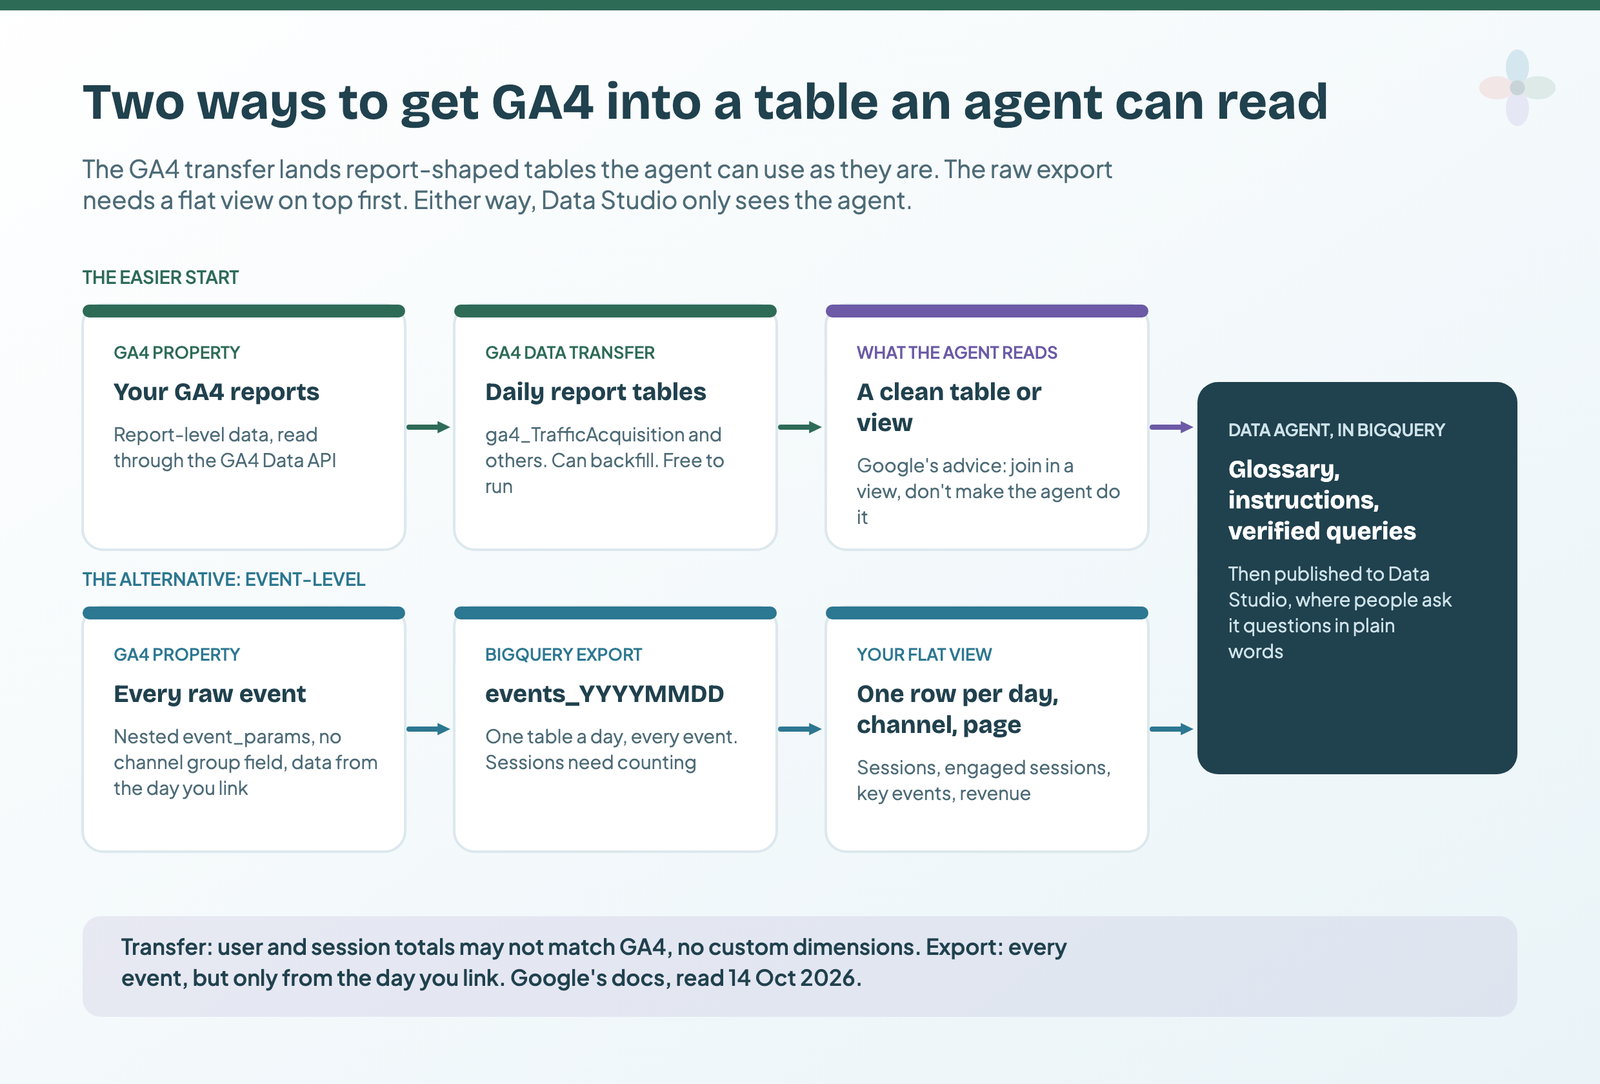
For everyday marketing questions, the transfer is the easier start: its tables speak GA4’s report language, include the default channel group, and backfill on day one. The export is the alternative for event-level questions or custom dimensions.
Set up the GA4 transfer
From Google’s GA4 transfer page. You need BigQuery Admin on the project and viewer access to the GA4 property:
- Create a BigQuery dataset for the GA4 tables, in the region you want the agent to live in.
- In the Cloud console, open BigQuery › Data transfers and click Create transfer.
- For Source, choose Google Analytics 4, and enter your GA4 Property ID.
- Optionally, list the tables you want in Table Filter and set a Refresh window (4 days by default, up to 30).
- Pick your dataset as the destination, name the transfer, set the schedule, and save.
- Run a backfill for the months you want the agent to know about.
Or link the raw event export
From Google’s export setup page. You need Editor on the GA4 property and Owner on the BigQuery project:
- In GA4, go to Admin › Product links › BigQuery links and click Link.
- Choose the project and the data location.
- Pick the streams and any events to exclude, then Daily and/or Streaming.
- Submit. Data starts arriving within 24 hours.
Google’s catch: the export needs a valid payment method, and data interrupted by a billing problem can’t be re-exported. Keep the GA4 connector you already use in Data Studio (connecting GA4 to Data Studio): it’s how you’ll check the agent later.
To practise SQL while you wait, query Google’s public GA4 sample dataset (bigquery-public-data.ga4_obfuscated_sample_ecommerce, November 2020 to January 2021) free in the sandbox. It’s obfuscated: SQL practice, not a stand-in for your data.
Step 2: Give the agent one clean table, not the raw events
Google’s own best practice is to clean your tables first and “join related tables in a view” rather than leave the joins to the agent. With the transfer, that’s mostly done: point the agent at ga4_TrafficAcquisition (channel, source/medium, campaign, sessions, engaged sessions, key events, revenue) and, if you need pages, ga4_LandingPage. Skip ahead to Step 3.
With the raw export, page and campaign details sit inside nested event_params, and sessions must be counted from ga_session_id: exactly where a model goes wrong. One flat daily view fixes it, and scans far less:
-- A flat GA4 view for your agent (raw export route).
-- Written from Google's docs, not tested here.
-- Replace my-project, analytics_123456789, reporting and the key-event names.
CREATE OR REPLACE VIEW `my-project.reporting.ga4_sessions_daily` AS
WITH ev AS (
  SELECT
    PARSE_DATE('%Y%m%d', event_date) AS event_day,
    CONCAT(user_pseudo_id, '.', CAST((SELECT value.int_value FROM UNNEST(event_params)
      WHERE key = 'ga_session_id') AS STRING)) AS session_key,
    event_name,
    event_timestamp,
    (SELECT value.string_value FROM UNNEST(event_params) WHERE key = 'page_location') AS page_location,
    -- session_engaged isn't on Google's schema page; check how your property sends it.
    (SELECT COALESCE(value.string_value, CAST(value.int_value AS STRING))
       FROM UNNEST(event_params) WHERE key = 'session_engaged') AS session_engaged,
    session_traffic_source_last_click.cross_channel_campaign.source AS source,
    session_traffic_source_last_click.cross_channel_campaign.medium AS medium,
    session_traffic_source_last_click.cross_channel_campaign.campaign_name AS campaign,
    device.category AS device,
    geo.country AS country,
    ecommerce.purchase_revenue AS revenue
  FROM `my-project.analytics_123456789.events_*`
  WHERE _TABLE_SUFFIX NOT LIKE 'intraday%'   -- stable daily tables only
    AND _TABLE_SUFFIX >= FORMAT_DATE('%Y%m%d', DATE_SUB(CURRENT_DATE(), INTERVAL 13 MONTH))
),
sessions AS (
  SELECT
    session_key,
    MIN(event_day) AS date,
    ANY_VALUE(source) AS source,
    ANY_VALUE(medium) AS medium,
    ANY_VALUE(campaign) AS campaign,
    ANY_VALUE(device) AS device,
    ANY_VALUE(country) AS country,
    ARRAY_AGG(page_location IGNORE NULLS ORDER BY event_timestamp LIMIT 1)[SAFE_OFFSET(0)] AS landing_page,
    MAX(IF(session_engaged = '1', 1, 0)) AS engaged,
    COUNTIF(event_name IN ('purchase', 'generate_lead')) AS key_events,  -- your key events
    SUM(IFNULL(revenue, 0)) AS revenue
  FROM ev
  WHERE session_key IS NOT NULL
  GROUP BY session_key
)
SELECT
  date, source, medium, campaign,
  -- An approximation of GA4's default channel group, not Google's definition.
  CASE
    WHEN source = '(direct)' AND medium IN ('(none)', '(not set)') THEN 'Direct'
    WHEN REGEXP_CONTAINS(medium, r'^(cpc|ppc|paid)') AND REGEXP_CONTAINS(source,
         r'facebook|instagram|linkedin|tiktok|pinterest|reddit') THEN 'Paid Social'
    WHEN REGEXP_CONTAINS(medium, r'^(cpc|ppc|paid)') THEN 'Paid Search'
    WHEN medium = 'social' OR REGEXP_CONTAINS(source,
         r'facebook|instagram|linkedin|tiktok|pinterest|reddit') THEN 'Organic Social'
    WHEN medium = 'organic' THEN 'Organic Search'
    WHEN medium = 'email' THEN 'Email'
    WHEN medium = 'referral' THEN 'Referral'
    ELSE 'Other'
  END AS channel,
  landing_page, device, country,
  COUNT(*) AS sessions,
  SUM(engaged) AS engaged_sessions,
  SUM(key_events) AS key_events,
  SUM(revenue) AS revenue
FROM sessions
GROUP BY date, source, medium, campaign, channel, landing_page, device, country;
Three deliberate choices: daily tables only, because Google calls them the stable dataset; a rolling 13 months, so no question scans your whole history; and a channel grouping labelled as an approximation (for GA4’s own, use the transfer). Check that your property sends session_engaged, and swap in your own key events. (Another BigQuery view: row-level security in BigQuery.)
Step 3: Create the data agent in BigQuery
From Google’s create data agents page:
- Look at the sample first: every project has a read-only one under “Sample agents by Google”.
- In BigQuery, open Agents › Agent catalog and click New agent.
- Name and description. Write the description for the people who’ll chat with it; they see it in Data Studio’s list.
- Knowledge sources › Add source. Add the one table or view from Step 2.
- Customise. Accept, fix or reject Gemini’s suggested field descriptions; they don’t change your table.
- Check the location. Agents live in the US, the EU or Global, default to your sources’ region, and can’t move after saving.
Test in the preview pane, then Save as a draft until Step 5 is done.
Step 4: Teach it your marketing definitions
This step makes “sessions from paid social last month” match your report. Google ranks the context you add in this order: verified queries first, then the glossary, then instructions, with table and column descriptions underneath.
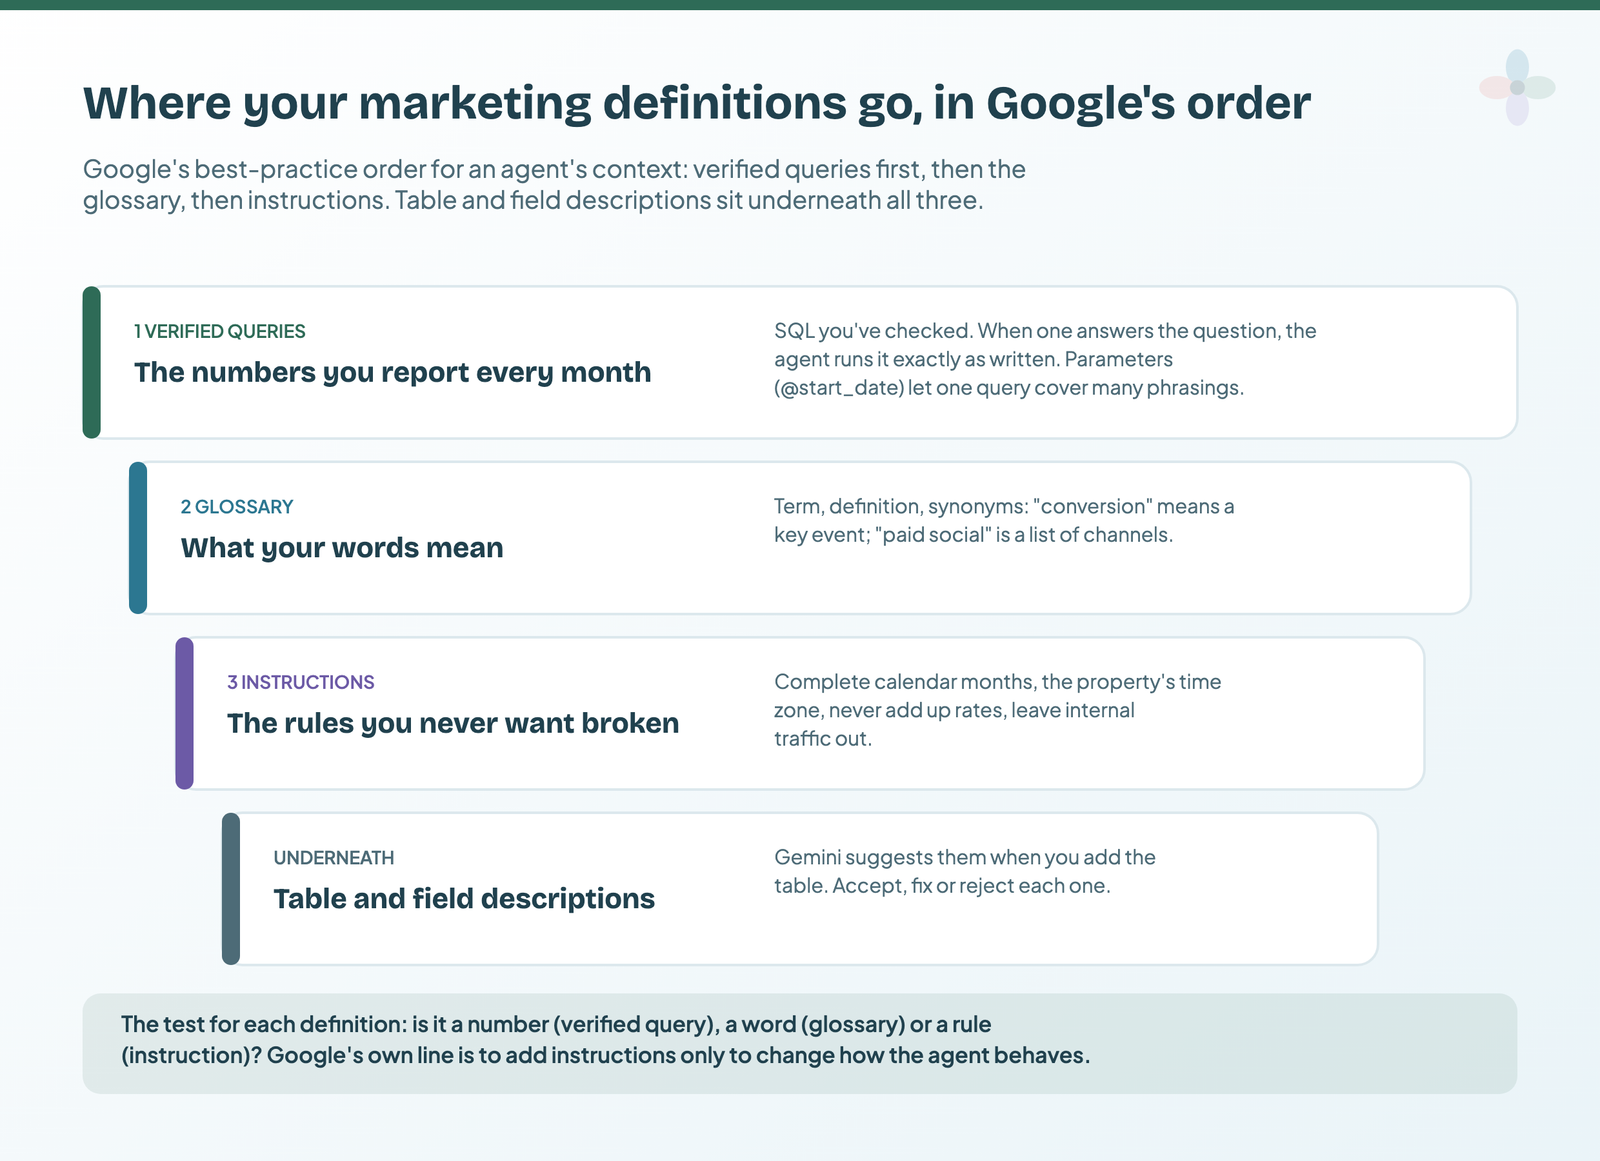
A verified query (formerly “golden query”) is SQL you’ve checked: when one answers the question, the agent runs it exactly as written. The glossary holds terms and synonyms; instructions change behaviour.
| Your marketing word or rule | Put it in | Example entry |
|---|---|---|
| “Conversion” | Glossary | Means a key event; synonyms: conversion, goal, lead |
| “Paid social” | Glossary | Sessions where channel is Paid Social |
| “Engaged session” | Glossary | Lasted over 10 seconds, had a key event, or had 2+ page or screen views |
| Engagement rate | Instruction | Always engaged sessions ÷ sessions; never average daily rates |
| “Last month” | Instruction | The last complete calendar month, in the property’s time zone |
| Internal traffic | Instruction | Exclude rows where source is the staging site |
| Sessions and key events by channel | Verified query | The monthly report table, with date parameters |
| Revenue by landing page | Verified query | Top 10 landing pages by revenue, for a date range |
Make your five monthly numbers verified queries, and parameterise them. Google supports @name placeholders, so one query answers “last month”, “Q3” and “September” alike. Against the transfer table, the first one looks like this:
-- Verified query: "What were sessions and key events by channel between two dates?"
-- Parameters: @start_date (DATE), @end_date (DATE).
-- Written from Google's docs, not tested here. Google's table reference doesn't list the
-- date column: open the table's Schema tab and use the name you see there.
SELECT
  sessionDefaultChannelGroup AS channel,
  SUM(sessions) AS sessions,
  SUM(keyEvents) AS key_events
FROM `my-project.ga4_transfer.ga4_TrafficAcquisition`
WHERE date BETWEEN @start_date AND @end_date
GROUP BY channel
ORDER BY sessions DESC;
In the editor, that’s Add query, type the question, Generate SQL, replace it with yours, Run, Add. Don’t define the same term in the agent’s glossary and in a Knowledge Catalog business glossary: Google says to pick one.
The kit has it all ready to paste: instructions, about 25 glossary terms and eight verified queries for both table types. (Data Studio’s own calculated fields are where the same metrics get defined on the report side. )
Step 5: Set the cost guardrails before anyone asks a question
Each question becomes a BigQuery job billed by the bytes it scans. Set three limits, then watch.
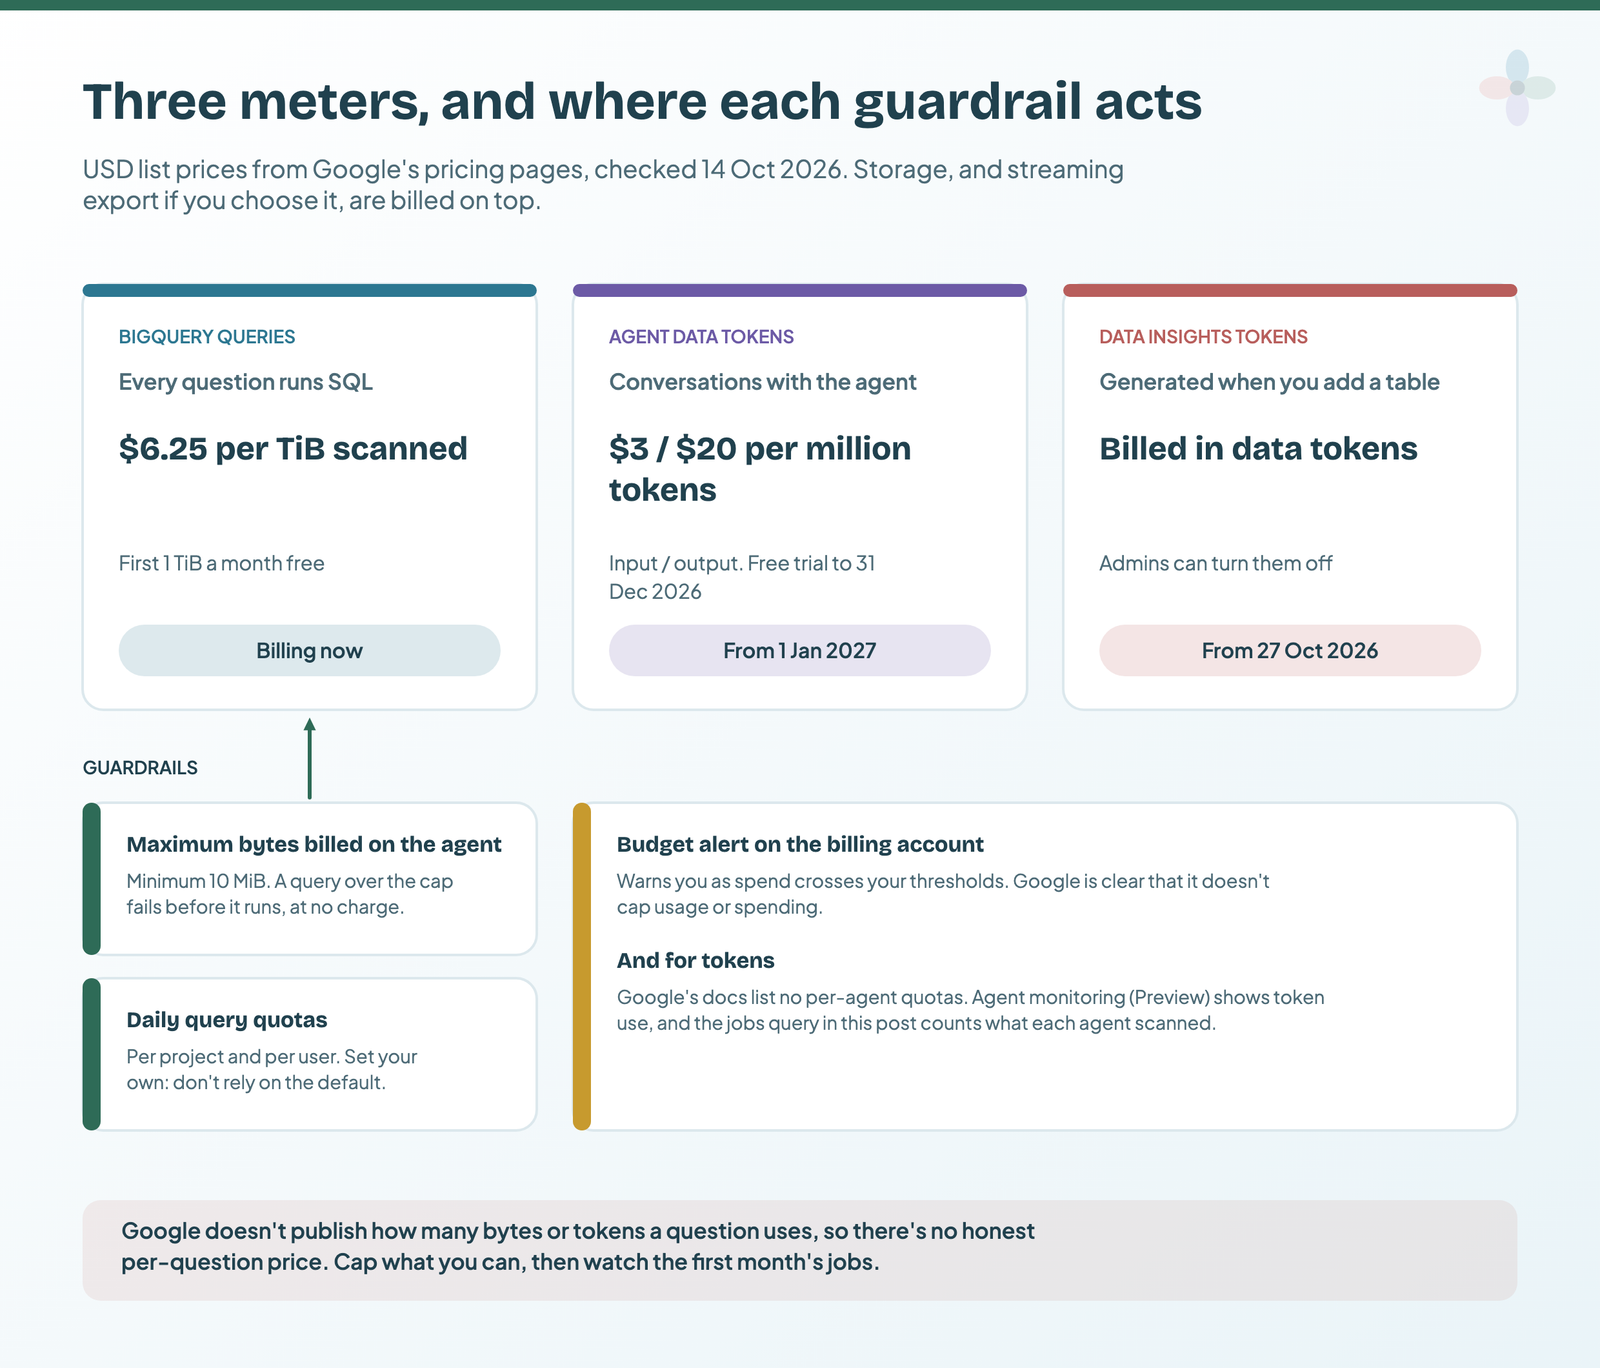
- Maximum bytes billed on the agent. In the agent’s settings, set it to at least 10,485,760 bytes (10 MiB, the minimum). Over the cap, the query fails before it runs, without charge (per the API docs). Left blank, it falls back to the project’s daily quota.
- Daily quotas. In IAM & Admin › Quotas, filter to the BigQuery API and set Query usage per day and Query usage per day per user. Google suggests a dedicated project for agents. Don’t rely on the default: one Google page says it’s unlimited, another says 200 TiB a day per project.
- A budget alert on the billing account. Useful, but Google is plain that alert budgets “don’t cap usage or spending”.
- Watch the jobs. Agent jobs carry the labels
ca-bq-jobanddata-agent-id, so you can count what each agent ran and scanned:
-- Google's job-count query, extended to bytes per day and per agent.
-- Google's base query plus my additions; not tested here.
-- Needs bigquery.jobs.listAll. Use your region: region-us or region-eu.
SELECT
  DATE(creation_time) AS day,
  (SELECT value FROM UNNEST(labels) WHERE key = 'data-agent-id') AS agent_id,
  COUNT(*) AS jobs,
  ROUND(SUM(total_bytes_billed) / POW(1024, 3), 2) AS gib_billed
FROM `my-project`.`region-us`.INFORMATION_SCHEMA.JOBS
WHERE creation_time >= TIMESTAMP_SUB(CURRENT_TIMESTAMP(), INTERVAL 30 DAY)
  AND EXISTS (SELECT 1 FROM UNNEST(labels) AS label
              WHERE label.key = 'ca-bq-job' AND label.value = 'true')
GROUP BY day, agent_id
ORDER BY day DESC, gib_billed DESC;
Beyond the free TiB, each GiB scanned costs about $0.0061 ($6.25 ÷ 1,024). On per-agent billing, Google’s docs disagree: BigQuery’s page says labels let you filter the billing report per agent; the API’s cost page says tracking individual agents by label “isn’t supported”. So count jobs and bytes with the query above, and don’t promise a client a per-agent invoice line. Token use shows in the agent’s Monitoring tab (Preview, off by default). For keeping BigQuery-backed reports cheap generally: extracting data in Data Studio.
Step 6: Publish it to Data Studio, share it, and fix “I can’t see the agent”
- Publish the agent and choose Data Studio as the publishing option. Drafts can’t be shared.
- Share › Add principal, role Data Agent User for people who’ll chat.
- Give them a project-level role (BigQuery Studio User or Gemini for Google Cloud User), Data Studio Asset Viewer, and BigQuery read access to the data.
- Tick Send email, or copy the agent’s link (catalog › ⋮ › Copy link › Data Studio).
- In Data Studio, they open Conversational Analytics › Chat with your data, where shared agents appear automatically.
“I shared it and they can’t see it” came up in four threads I read (three on Google’s forum, one on Stack Overflow). Google’s setup page explains most of it (for report sharing itself, see sharing Data Studio reports):
| Symptom | Likely cause | Fix |
|---|---|---|
| No agents in the list at all | The project isn’t in their recent Cloud projects | They open the project once in the Cloud console |
| Agent shows as Unavailable | A missing role | The card names the role; grant it |
| Works from the link, missing from the list | Project filter, or the project-listing gap above | Check the project filter; send the direct link meanwhile |
| Opens, but questions fail | No bigquery.jobs.create or no read access to the data |
Grant both on the right projects |
| They can’t see your past conversations | Expected: history is private | Share the question, not the thread |
Step 7: Ask questions you can check
Name the metric, the date range and the breakdown, one thing at a time. Follow-ups only use the active conversation.
| Vague | Better |
|---|---|
| How’s traffic? | Sessions by channel for September 2026 |
| Are conversions up? | Key events by month, January to September 2026 |
| Best pages? | Top 10 landing pages by revenue, last complete month |
| How’s paid doing? | Sessions, key events and revenue for Paid Search and Paid Social, September vs August |
| Why did traffic drop? | Sessions by channel by week, August and September 2026 |
Then check before a number leaves the building (a method; I haven’t run it yet):
- Read the method. Open How was this calculated? The Code tab shows the BigQuery SQL it ran: table, filters, dates.
- Rebuild one number in Data Studio for the same dates, with the GA4 connector or a BigQuery chart on the same table.
- Log it in the kit’s test-questions tab: question, agent’s answer, report’s number, match.
Charts from a conversation can’t be added to a report; recreate the good ones (maps and heatmaps may misbehave).
What it answers well, and where GA4 data trips it up
Per Google’s known limitations, it answers what a single visualisation can.
| Question type | How it does | Why |
|---|---|---|
| Trends, breakdowns, top N, single numbers | Well | One chart answers them |
| Your monthly report numbers | Well, with verified queries | It runs your SQL as written |
| “Why did X happen?” | Poorly | It describes; it doesn’t diagnose |
| Forecasts, correlation, anomalies | Not supported | Needs the Code Interpreter (Pro + Gemini) |
| Users and sessions vs GA4’s interface | Won’t always match | Modelling, thresholds, consent mode, time zones, session counting |
| Rates over periods | Risky without an instruction | Averaging daily rates gives the wrong number |
| Your channel grouping | Only if you defined it | The raw export has no channel group field |
The API caps a query at 500 GB processed and a project at 30 chat requests a minute. And Google warns it “can generate output that seems plausible but is factually incorrect”. For the “why”, see AI commentary for client reports. If an agent’s answer ends up in a client’s commentary, Chapter 24 of my ebook, Data Storytelling in Data Studio, covers the guardrails I use for AI-drafted commentary and how to say whether a claim is measured, inferred or assumed.
Privacy settings to check before client data goes in
Not legal advice, but Google’s documented defaults, one with a deadline:
- ☐ Prompt analytics is on by default (anonymised; Google says not used to train its foundation models). Opt out by form before 23 November 2026, or with the org-policy constraint
constraints/gcp.disablePromptAnalyticsafter. - ☐ The agent reads only what the asker can, can’t write, and uses only the sources you picked.
- ☐ Conversation history is private to each user.
- ☐ Retention: conversations are deleted after 180 days without activity.
- ☐ The client’s contract allows AI processing of their analytics data.
The agency side of this is in client data and AI assistants.
When an MCP route is the better choice
Data Studio has no MCP server, but GA4 does:
| Route | Data needed | Who asks | Cost | Best for |
|---|---|---|---|---|
| Conversational Analytics | GA4 in BigQuery | Anyone you share with, in Data Studio | BigQuery queries, plus tokens from 2027 | Teams and clients who need the same governed answers |
| Google’s GA4 MCP server | Just GA4 | One analyst, in Claude or Gemini | Server free (local, read-only, experimental); your assistant’s plan | Ad-hoc questions without BigQuery |
| A connector’s MCP | The connector’s sources | Whoever has the connector | The vendor’s plan | Several platforms at once, no BigQuery |
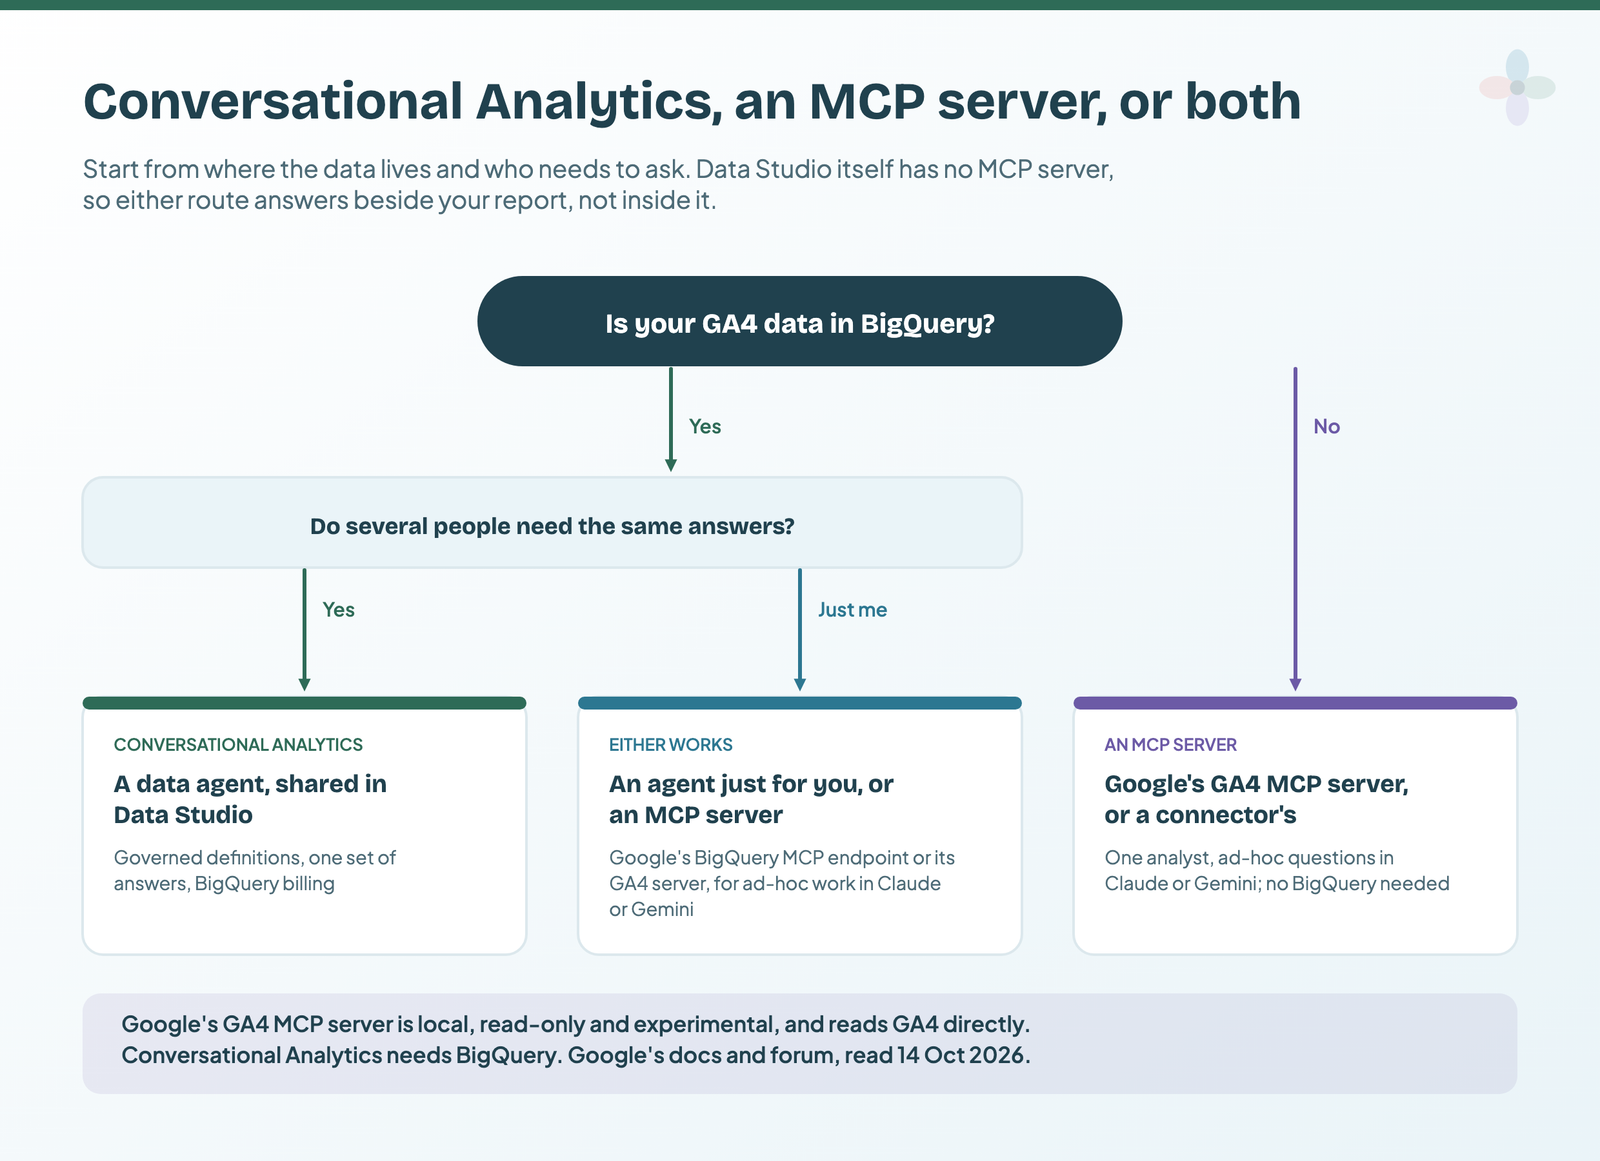
The setup for the MCP routes is in connecting GA4 to Claude or ChatGPT, and the connectors are weighed in marketing data MCP servers compared.
Templates that run on GA4 data in BigQuery
A report on the same BigQuery data is the best check on the agent:
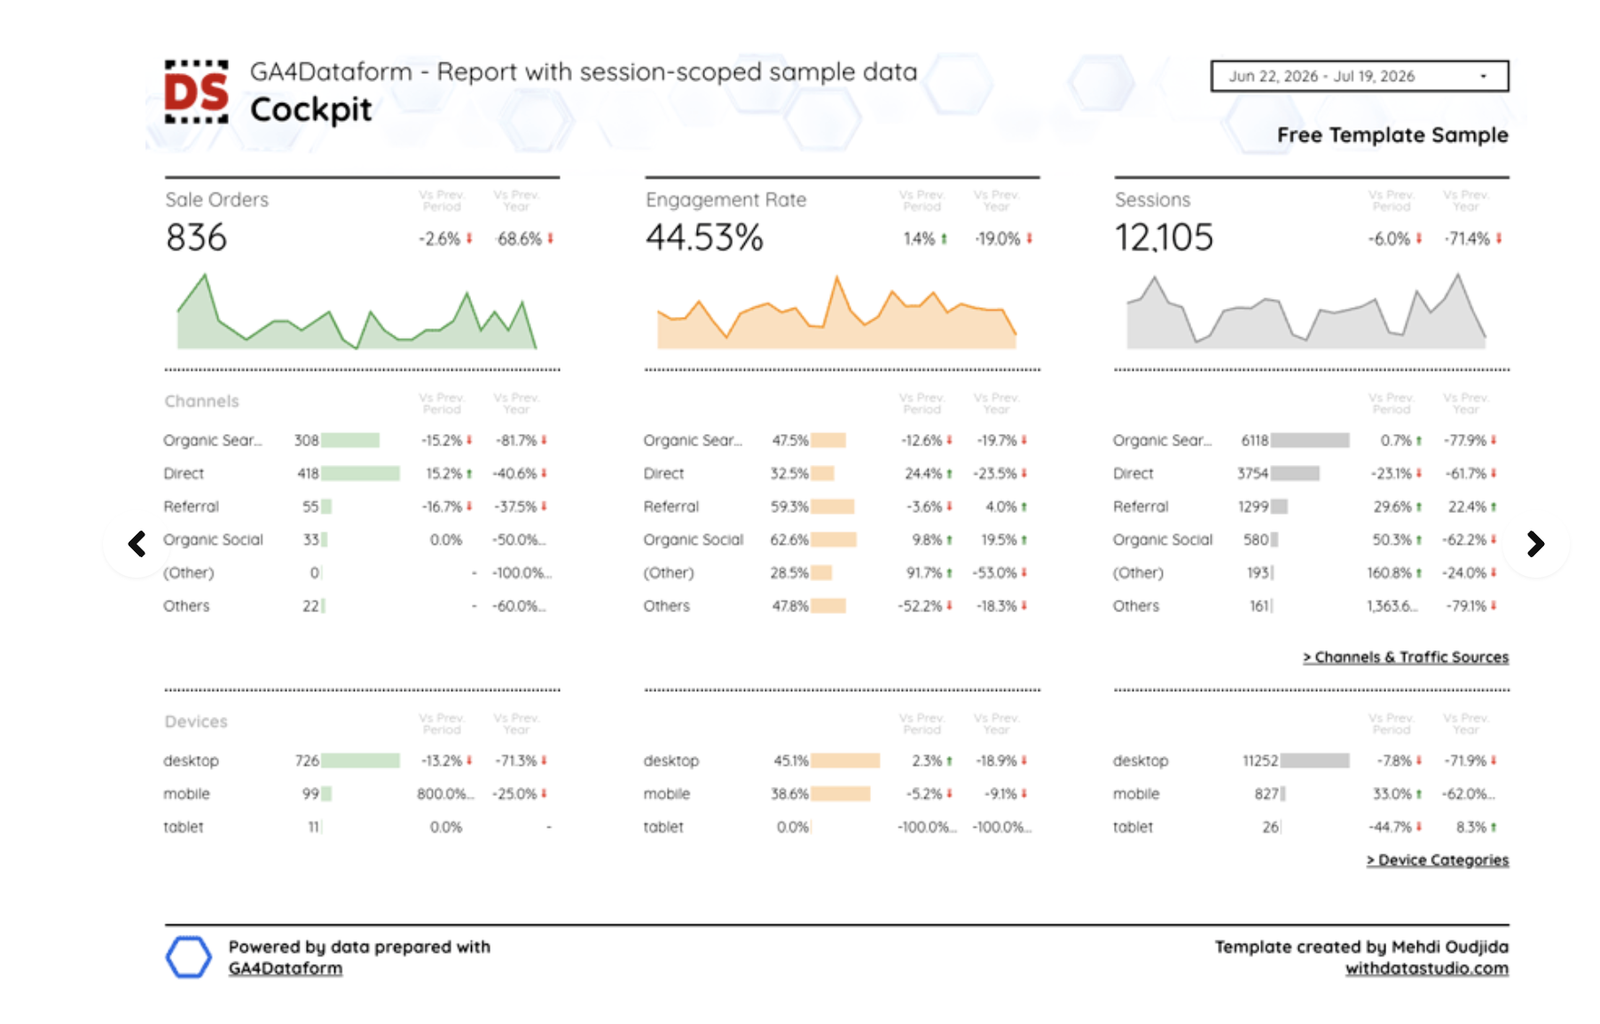
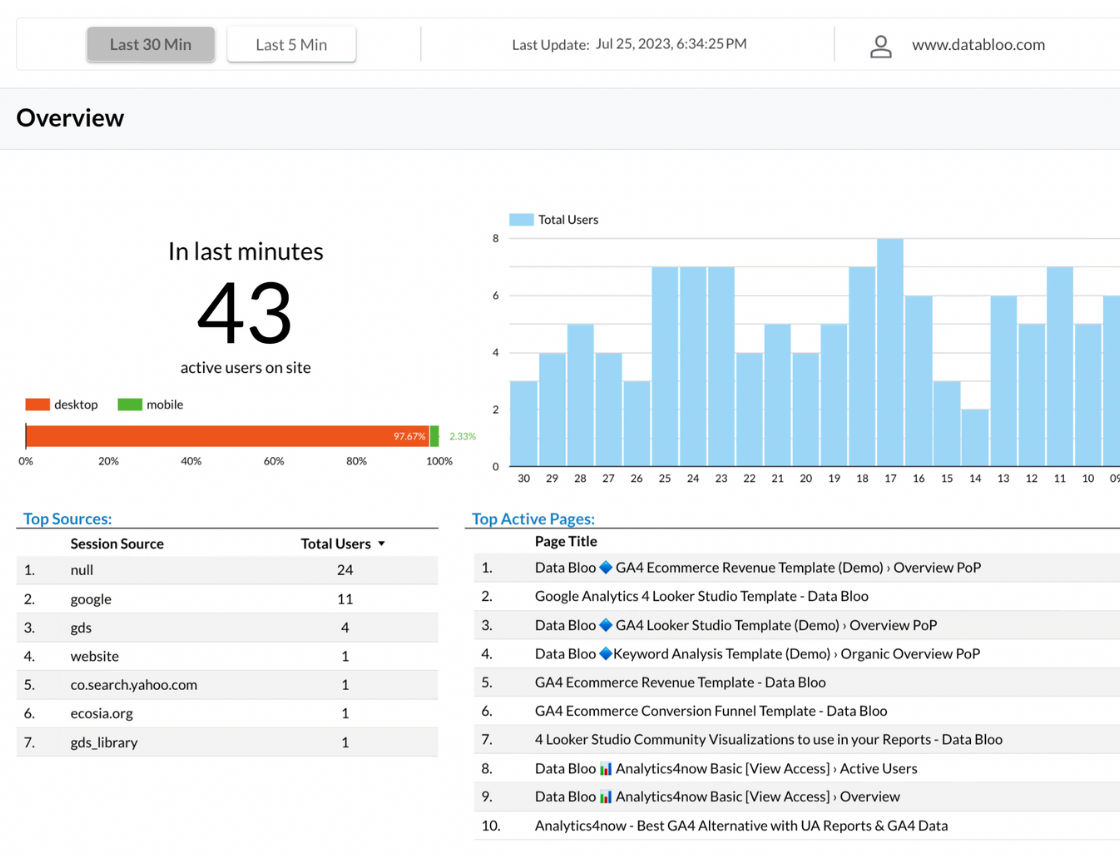
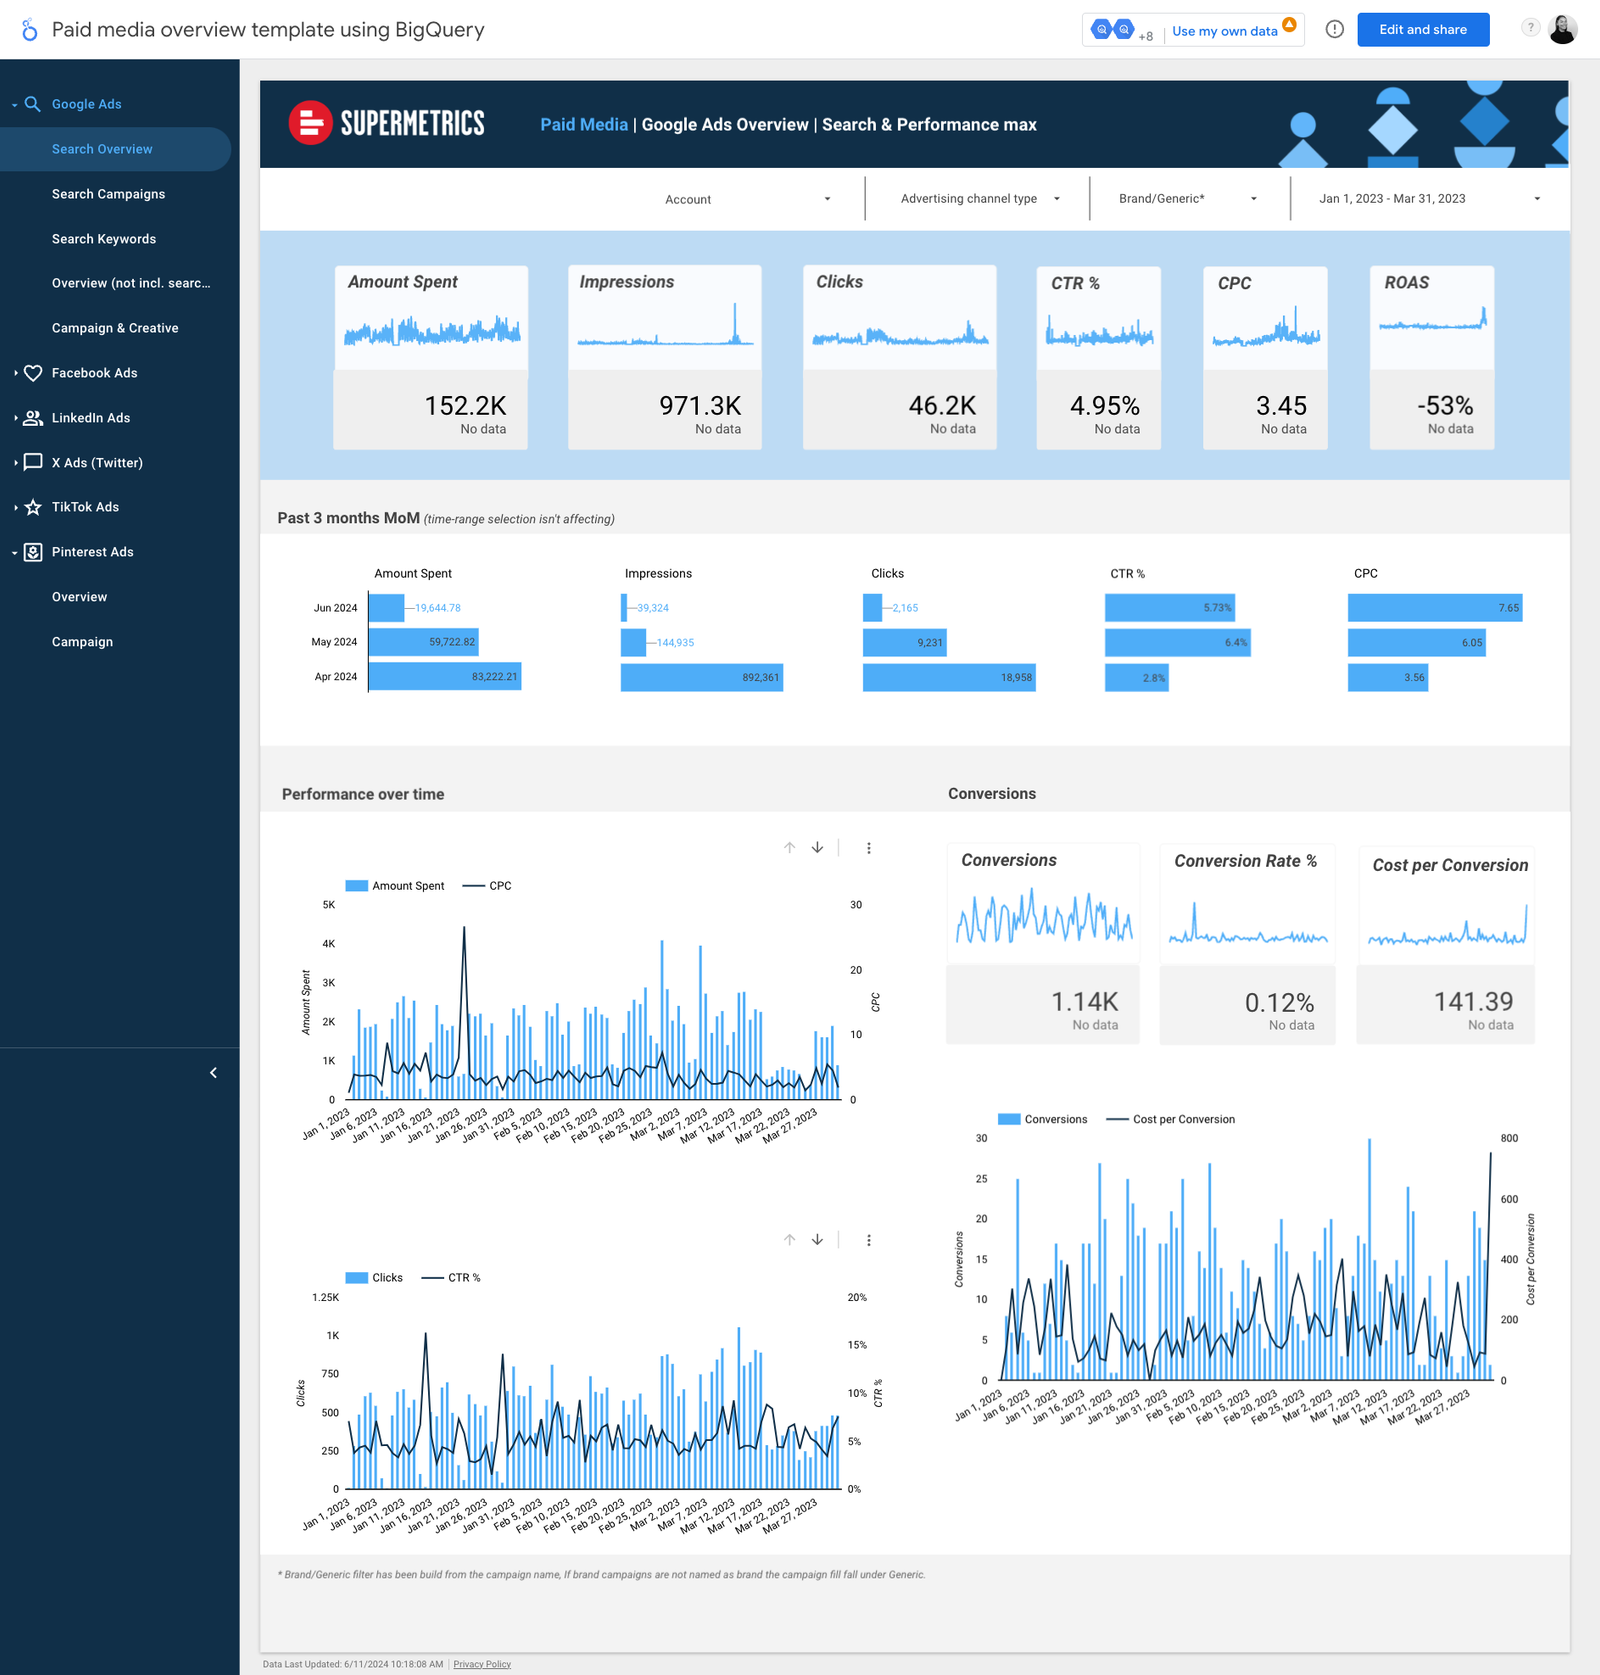
Where to go next
- AI in Data Studio: what Gemini does, what’s free, and what to use instead
- Connect GA4 to Claude or ChatGPT, the no-BigQuery route
- Data Studio free vs Pro
- Connect GA4 to Data Studio, for checking the agent
- Extract data in Data Studio
Frequently asked questions
Do I need Data Studio Pro for Conversational Analytics?
No. The new experience is available to all Data Studio users. Only its Code Interpreter, for forecasts and advanced statistics, needs Pro with Gemini.
Can I use the free BigQuery sandbox?
No. Google’s agent setup asks for billing to be enabled, and the sandbox has no billing account.
How much does it cost?
BigQuery queries after the free 1 TiB a month ($6.25 per TiB, USD list), data insights tokens from 27 October 2026, and agent data tokens ($3 / $20 per million input / output) after the free trial ends on 31 December 2026. Google publishes no per-question figure.
Does it work with Google Sheets or GA4 directly?
Not in the current experience: only BigQuery data agents. Sheets was the legacy, Pro-only version.
Why can’t my client see the agent?
Usually a missing role, or the project isn’t in their recent Cloud projects. Have them open it once in the Cloud console.
Some links in this post are affiliate links: if you sign up through one, I may earn a commission at no extra cost to you. How I work with partners.