
To embed a Data Studio report, open it in the editor, choose File > Embed report, tick Enable embedding and paste the iframe code it gives you into your page. Whether anyone can actually see it is decided somewhere else: by the report’s sharing setting and its data source credentials. That second sentence matters most when the page is a client portal.
This guide covers Data Studio (formerly Looker Studio):
- which sharing setting a public website and a client portal each need, and whose credentials run the charts;
- embed code versus embed URL, and where each goes in WordPress, Google Sites, Notion and portals;
- making the report fit its frame without scrollbars or white space;
- showing each client their own view with URL parameters, and why that isn’t security;
- refresh, wall screens, and the privacy checks before you publish.
What this is based on: Google’s Data Studio documentation and developer guides (read 13 October 2026), Google’s release notes, threads on Google’s Data Studio forum, and my own notes from the free editor (September 2026). I haven’t run a fresh embed test for this post. Where a behaviour comes from a forum report rather than Google’s docs, I say so. It’s part of my series on automated client reporting in Data Studio.
Three decisions to make before you click Embed
The iframe is just a window. It adds no protection of its own; two settings decide what happens inside it.
1. The link setting decides who can open it. In the Share dialog, Link settings offers Restricted (the default), Unlisted and Public. Google’s embedding page is plain about the consequence: a report shared publicly can be seen by anyone viewing your page, while a report shared with specific users, groups or domains can be seen only by them, and they must be signed in to a Google account. A public link needs no login at all.
2. The credentials decide whose access runs each chart. A data source using owner’s credentials lets viewers see the data without their own access to the dataset (Google’s advice: share only with people you trust). With viewer’s credentials, every viewer needs their own access to the underlying data. A third mode, service account credentials, is for BigQuery. My post on data sources and credentials goes deeper.
| Link setting | Who sees the embed | Google login needed? | With owner’s credentials | With viewer’s credentials |
|---|---|---|---|---|
| Public | Anyone on your page; the report can also be found | No | Everyone sees your data | Only viewers with their own data access see numbers |
| Unlisted | Anyone on your page, or anyone with the URL | No | Everyone sees your data | As above |
| Restricted + people | Only the people and groups you add | Yes, as one of them | Invited people see your data | Invited people with data access |
| Restricted + domain (Workspace) | Anyone signed in to your organisation | Yes, a work account | Your whole domain sees your data | Colleagues with data access |
Google’s sharing doc calls these “Anyone with the link can view” (Unlisted) and “Anyone on the Internet can find and view” (Public). A Workspace or Cloud Identity admin may have removed the public options.
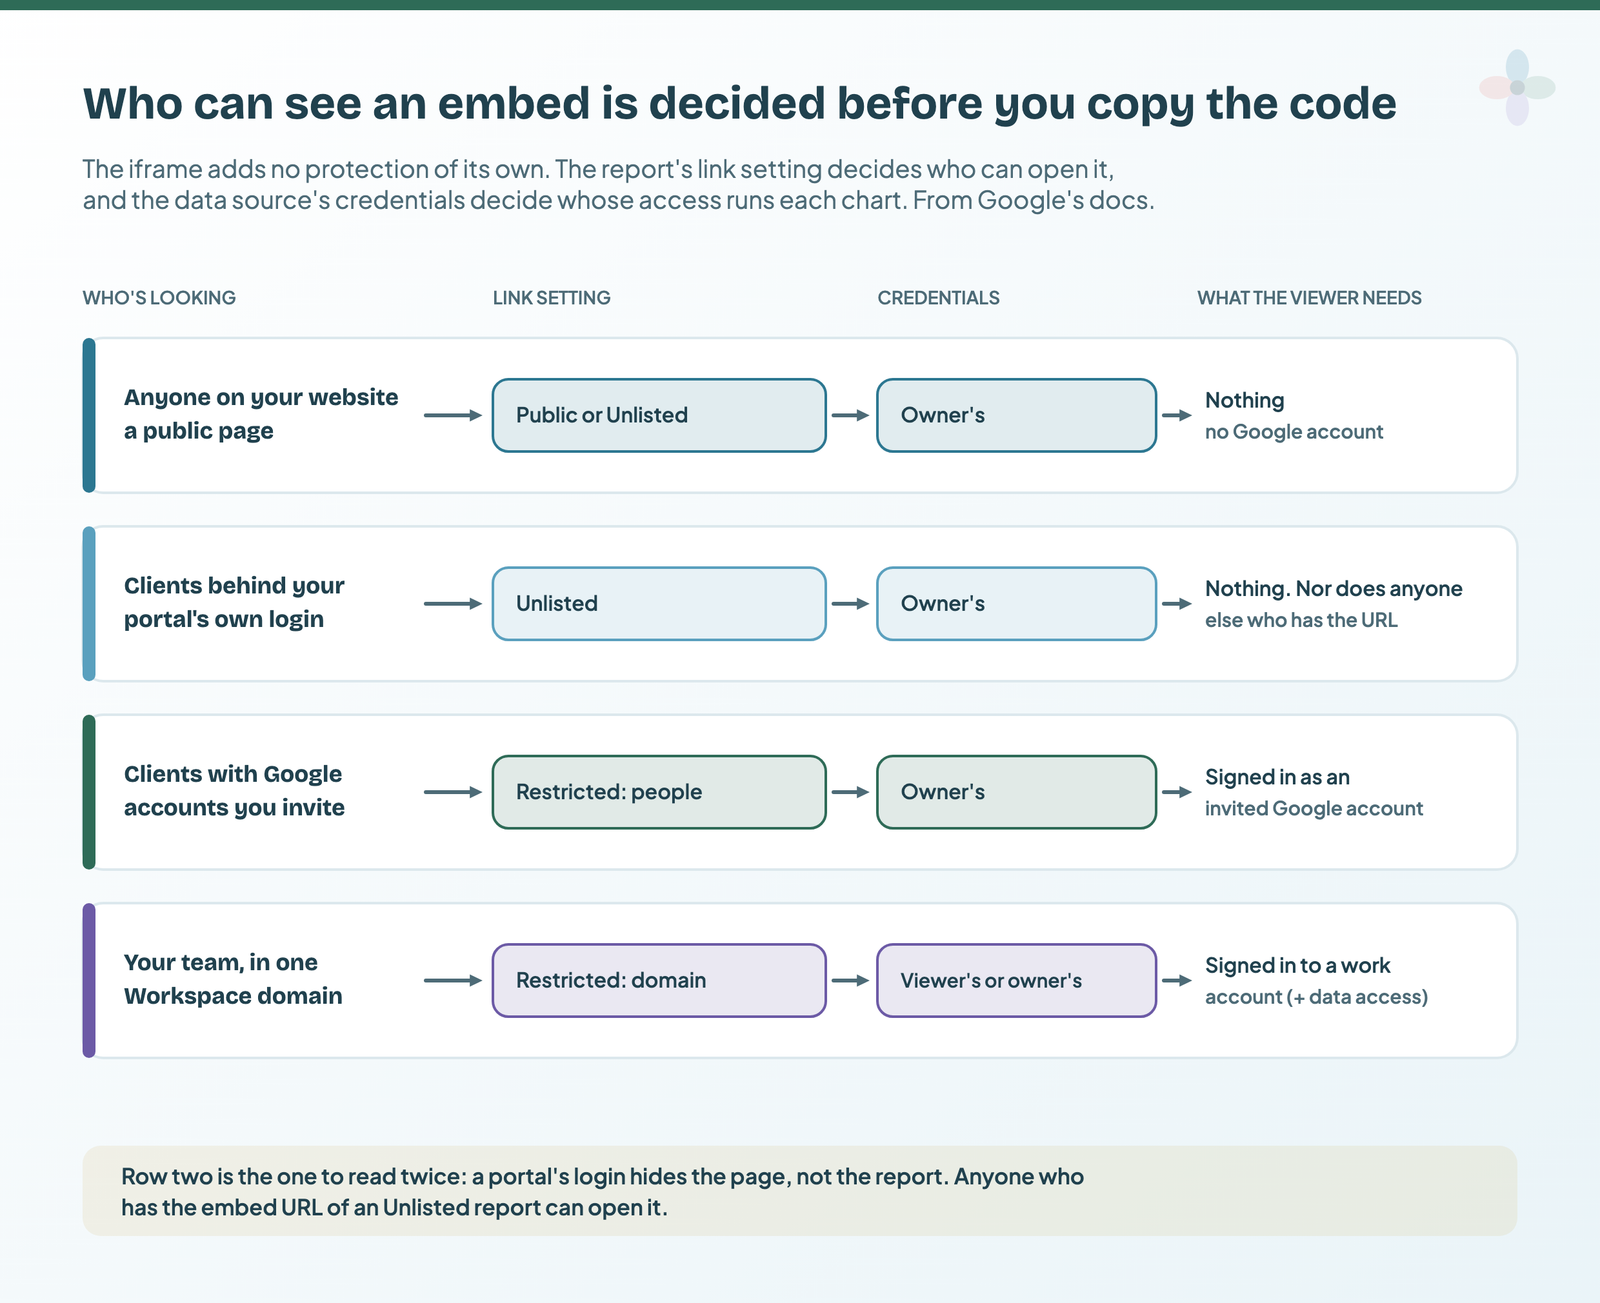
The forum says the same. Google staff answer that an embed without a Google account means sharing the report publicly (August 2024), and a March 2026 thread lands in the same place for owner’s credentials.
3. Which page. The embed is made from whatever page you’re on, so navigate to the page you want before you generate the code. For sharing in general, my guide to sharing and scheduling covers the rest.
Turn on embedding and copy the code, step by step
Six steps, from Google’s embedding page:
- Share the report with the setting you picked above.
- Edit the report and go to the page you want to embed.
- Choose File > Embed report (or the Embed button at the top right).
- Tick Enable embedding. Leave Embed code selected, and set a width and height if you want something other than the default.
- Click Copy to clipboard. Use this code: Google says the standard shareable link won’t embed.
- Paste it into your page’s HTML where the report should appear.
The same dialog has a second option, Embed URL, which gives you only the address, and a toggle, Show report navigation in embedded mode. Without it, a multi-page report shows its page navigation along the bottom of the frame; with it, the report’s own navigation appears instead. If you’ve built custom navigation, my post on navigation menus covers how to make it survive an embed.
The code is an iframe whose src points at the report’s /embed/ address. Its shape:
<iframe width="1200" height="900"
  src="https://datastudio.google.com/embed/reporting/REPORT_ID/page/PAGE_ID">
</iframe>
That’s the documented shape only: Google doesn’t document the attributes the dialog adds, so copy the real code and its domain. To stop the embed, open the same dialog and untick Enable embedding; the report stops appearing on other sites and stays viewable in Data Studio.
Embed code or embed URL: what each platform wants
Anything that accepts HTML gets the code; anything that asks for a link gets the Embed URL.
| Platform | Use | Where to paste | Watch out for |
|---|---|---|---|
| WordPress (block editor) | Embed code | A Custom HTML block | Only roles with unfiltered_html can save raw HTML: Administrators and Editors on a single site, not Authors or Contributors |
| Google Sites | Embed URL | Embed > Embed from the web > Insert | Content embedded inside the report has its own permissions |
| Notion | Embed URL | Type /embed and paste |
Embeds that need a login don’t work in Notion’s desktop or mobile apps |
| Client portals | Either, as the portal asks | The portal’s embed field, one page per client | The portal’s login doesn’t change who can open the report |
| oEmbed sites | Embed URL | Wherever the site takes an embedding URL | Google names Reddit and Medium, and Embed.ly as an oEmbed service |
WordPress
Paste the code into a Custom HTML block. If it won’t save, your role lacks unfiltered_html.
Google Sites
Copy the Embed URL, edit your site, click Embed, paste it into the “Embed from the web” dialog and click Insert.
Notion
Type /embed and paste the Embed URL. Notion says embeds that require a login don’t work in its desktop and mobile apps, so a Restricted report only shows in a browser.
Client portals
Portal tools take either, usually on a per-client page. The portal’s login protects the portal page, not the report. If the report is Unlisted, anyone who has its URL can open it outside the portal.
What an embedded report can and can’t do
Embedded reports open in view mode and stay interactive. Google’s list, plus one forum report:
| In an embed | Works? | Source |
|---|---|---|
| Filter controls and date range controls | Yes, “as normal” | |
| Edit, copy or share the report | No: there’s no menu bar | |
| Manual data refresh | No: data refreshes when the freshness threshold expires | |
| Custom bookmark links | No | |
| Remove the watermark or the full-screen option | No: “You can’t remove these” | |
| Page navigation | At the bottom by default, or the report’s own with the navigation toggle | |
| Open the report in Data Studio | Yes: a link at the bottom | |
| “Link to this component” in the chart menu | Present unless the chart header is hidden | Forum, 2026 |
The last row is from a February 2026 forum thread: there’s no separate switch, so the community answer is to hide the chart header, though one May 2026 reply reports reaching it by right-click anyway. Google’s embed page carries no Pro exception for any of these, so I wouldn’t expect Data Studio Pro to change them.
Single-page reports are the easiest to embed, because nothing hides behind page navigation. That one page then has to make its point without anyone clicking through, which is the job of the summary page I build in Chapter 22 of my ebook, Data Storytelling in Data Studio.
Make it fit: canvas, display mode and a responsive frame
Most scrollbar problems come from sizing the frame first and the report second.
- Check the canvas size in Theme and layout > Layout. A custom canvas can be from 10 × 10 px up to 2,000 px wide and 10,000 px high, and pages can override the report’s size.
- Set Display mode to Fit to width. Google: it scales the canvas to the window width when the canvas is smaller than the window. Actual size shows components at their real size.
- Match the frame’s ratio to the canvas. A 1200 × 900 canvas is 4:3, so the frame should be 4:3 at whatever width the page gives it.
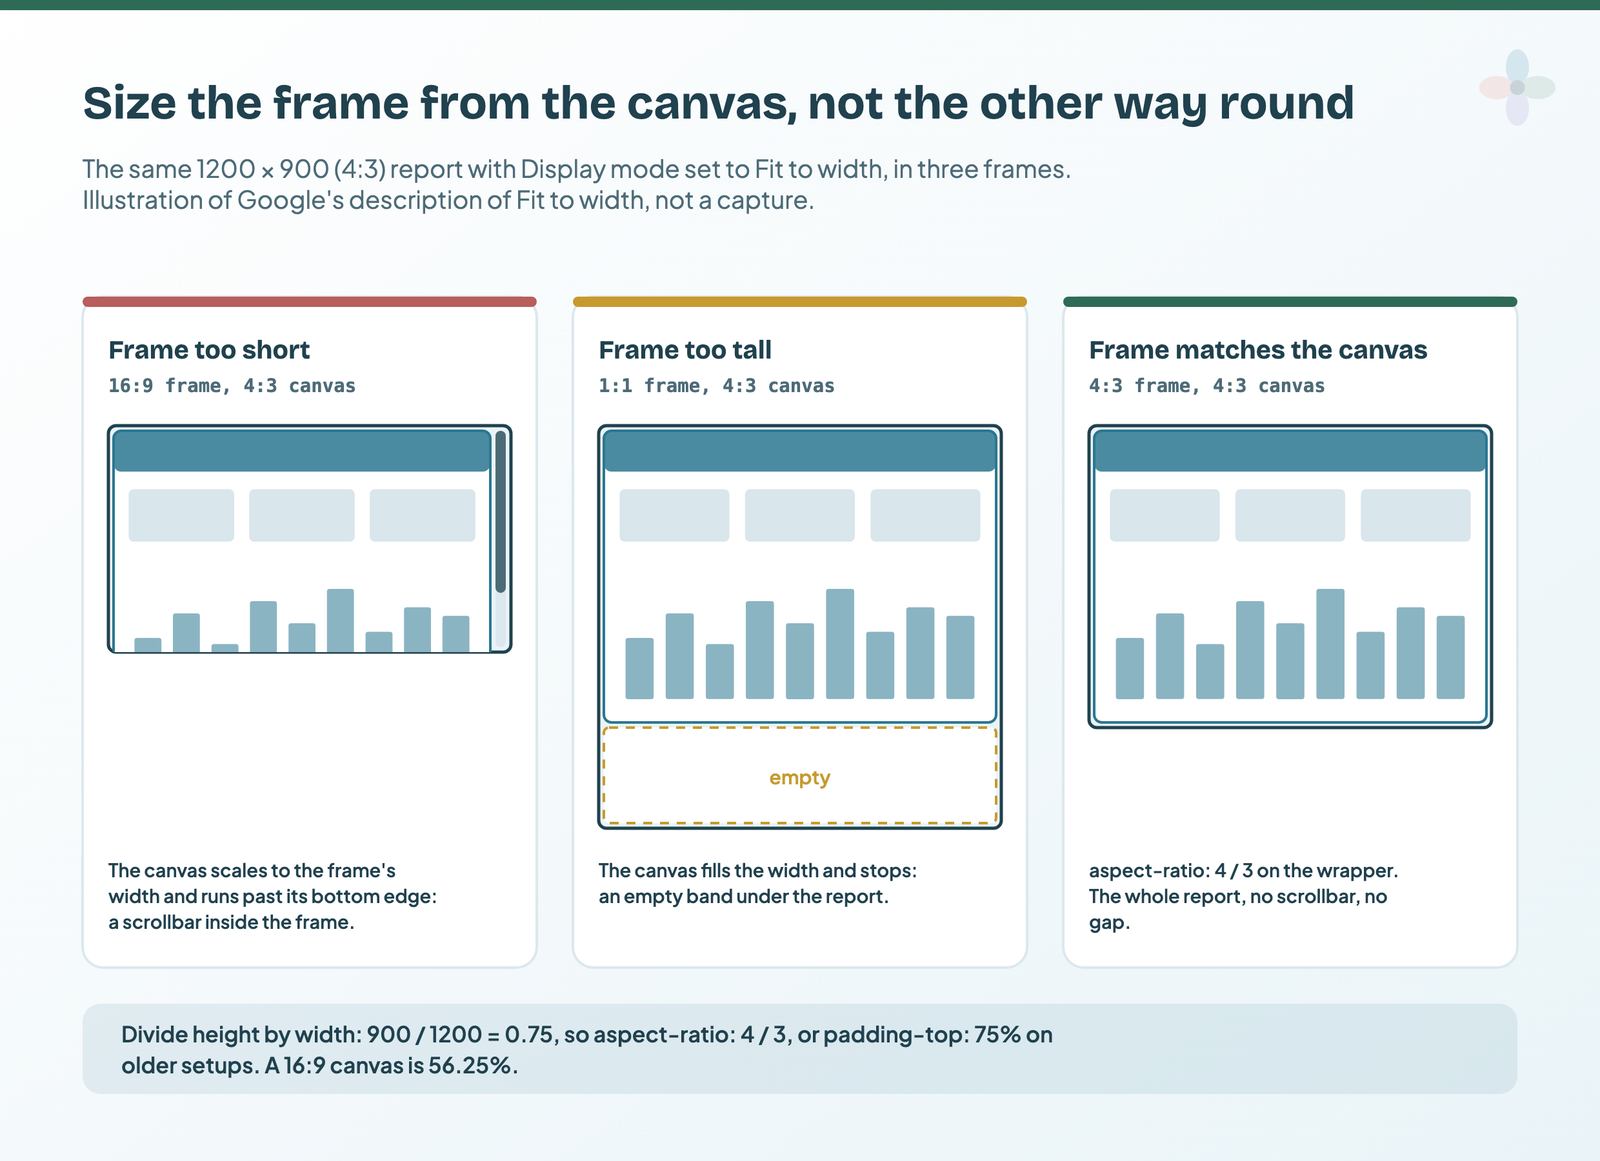
A fixed width="1200" iframe overflows a phone screen. The fix is a wrapper that keeps the ratio and lets the width follow the page, using CSS aspect-ratio:
<div style="position:relative; width:100%; aspect-ratio:4 / 3;">
  <iframe src="YOUR_EMBED_URL"
    style="position:absolute; inset:0; width:100%; height:100%; border:0;"
    allowfullscreen></iframe>
</div>
On older setups the same idea is padding-top: 75% on the wrapper (900 ÷ 1200); for a 16:9 canvas it’s 56.25%. The companion Sheet below works it out from your canvas size.
If the report will mostly be read on phones, build it as a responsive report instead: components sit in full-width sections and reflow, and the canvas size and grid aren’t configurable. My mobile-friendly reports post compares the two layouts.
Show each client their own view with URL parameters
A custom bookmark link per client (File > Report settings > “Enable viewer settings in report link”) won’t work: Google says bookmark links can’t be used with embedded reports, and a 2025 forum reply found exactly that in a WordPress iframe.
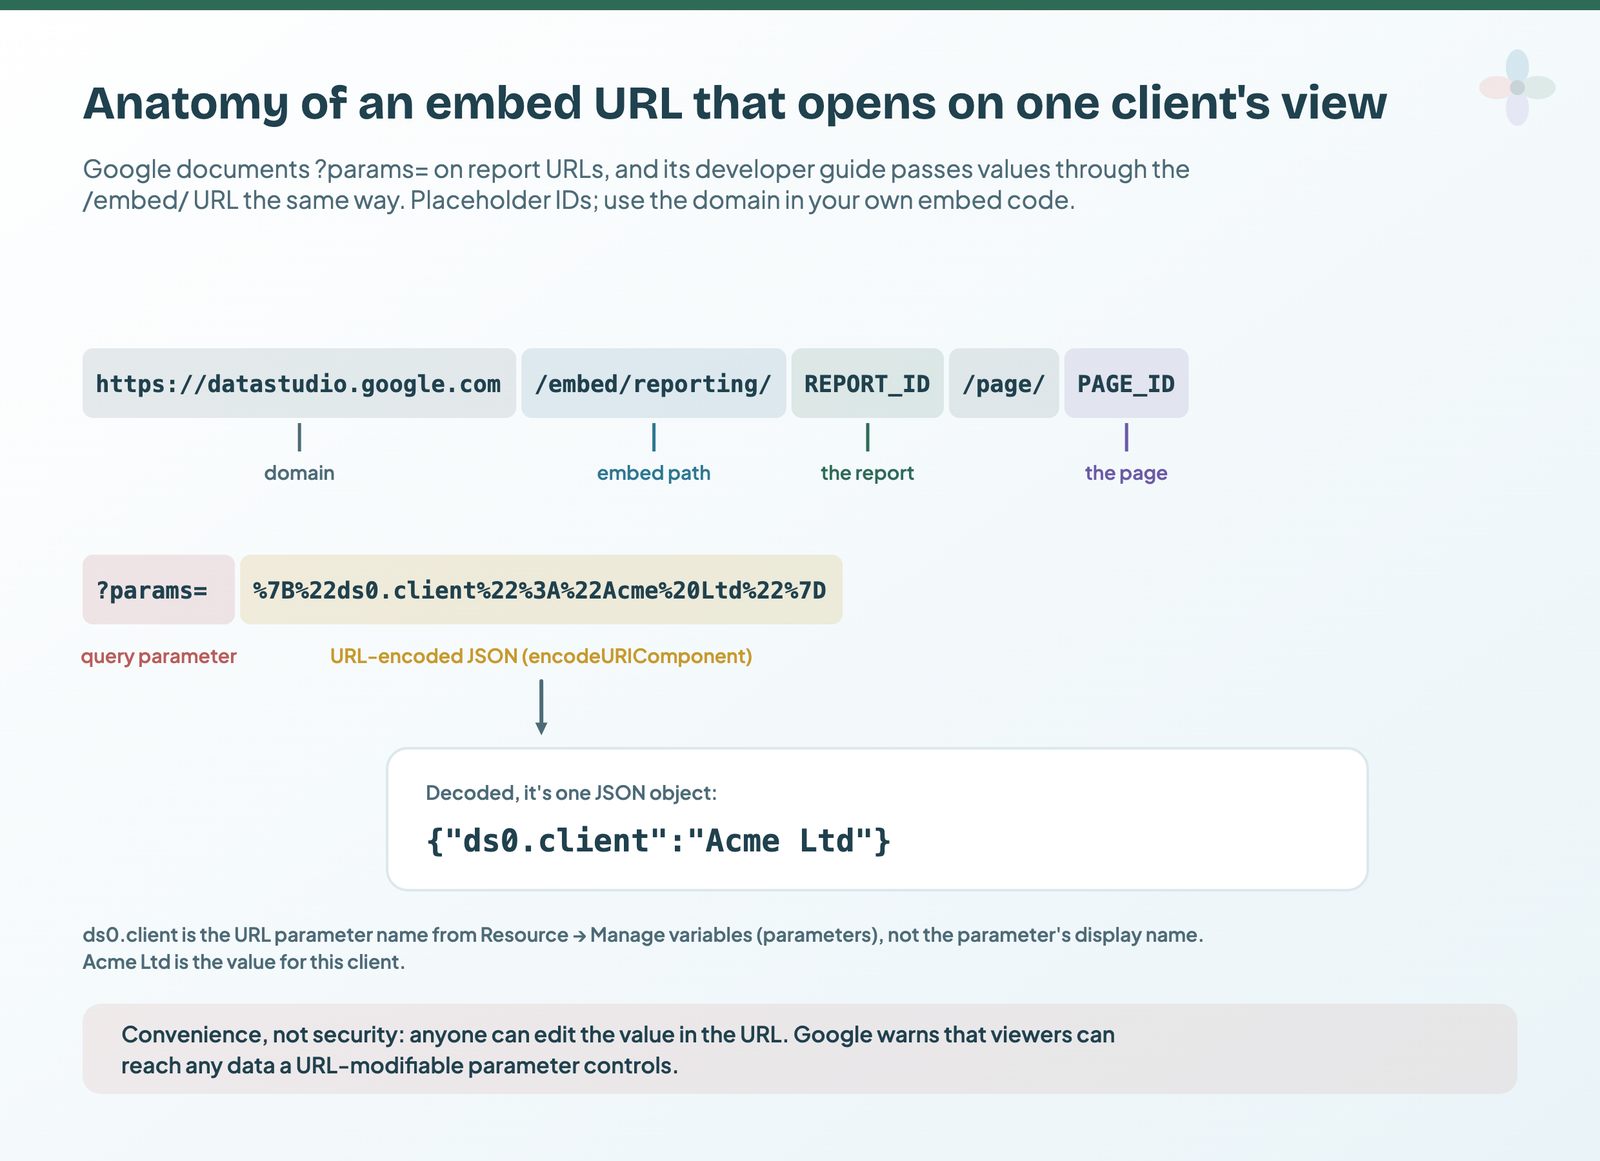
Report parameters are the route. A parameter is a value a report can take from outside, and Data Studio can read it from the report’s URL as a URL-encoded JSON object in a params query parameter. Google documents this for report URLs, and its own developer guide for embeds passes values through the /embed/ URL the same way. A forum user also reported it working on an embed URL in July 2024, with one catch: the watermark link opened the full report without the parameters. I haven’t tested it for this post.
Five steps. The filter in step 2 is my recipe: Google documents parameters in calculated fields and filters on fields, but not this exact combination. All code here is written from Google’s docs, not tested here.
- Add a parameter to the data source. Edit the data source, click Add a parameter, name it (say
Client filter, so it can’t clash with your Client field), data type Text. Give it a default that matches no client, such asnone, so a URL without parameters shows nothing useful. - Filter on it through a calculated field. Create a field that returns 1 when the row’s client matches the parameter, then add a report-level filter: Include,
Client matchequal to 1.Client match = CASE WHEN Client = Client filter THEN 1 ELSE 0 END - Allow it in the URL. Resource > Manage variables (parameters), then tick “Allow to be modified in report URL” for it. Note the URL parameter name the panel shows. That’s the name the URL uses, not the display name; it’s editable and must be unique. The examples below use
ds0.client.
- Build the JSON and encode it. Keys are URL parameter names; values are strings, numbers or booleans, and a multi-select takes an array.
{"ds0.client":"Acme Ltd"}Google’s method is
JSON.stringify()thenencodeURIComponent():const params = { "ds0.client": "Acme Ltd" }; const encoded = encodeURIComponent(JSON.stringify(params)); // %7B%22ds0.client%22%3A%22Acme%20Ltd%22%7D - Append it to the embed URL as
?params=. In Google Sheets, with the report ID in B2, the page ID in C2 and the JSON in D2:="https://datastudio.google.com/embed/reporting/"&B2&"/page/"&C2&"?params="&ENCODEURL(D2)
Per Google’s developer guide, a value set in the properties panel beats the URL, which beats the data source default. (Its row-level security guide uses ?config= for connector settings; for report parameters, use params.) Filter controls still work on top; my filter-controls post explains how they combine with fixed filters.
Why a URL parameter isn’t a lock, and what is
Anyone who can open an embed URL can edit it. Change Acme Ltd to another client’s name and, with the recipe above, that client’s numbers appear. Google says it directly: report viewers can access any data controlled by parameters that can be modified in the URL, and parameters controlling sensitive data, such as account selection, shouldn’t be overridable. Its bookmark-link page says the same of viewer settings in URLs: don’t use them to restrict access.
So a URL parameter is for convenience on data every viewer may see. To keep clients apart, pick one of the other three:
| Approach | Stops a curious client? | Google login needed? | Who builds it | At scale |
|---|---|---|---|---|
| URL parameter | No | No | You, in the editor | One report, one URL each |
| One copy per client | Yes, if each copy is shared Restricted to that client; Unlisted is only as private as the link | Restricted: yes | You, per client | A report each to maintain; up to 1,500 people and groups per report |
| Filter by viewer email | Yes: rows match the signed-in address | Yes, even on a public report, plus consent | You, in the data source | One report; addresses live in the data |
| Token + community connector | Yes, if built as Google describes | No: viewers log in to your app | A developer | One report; your app issues tokens |
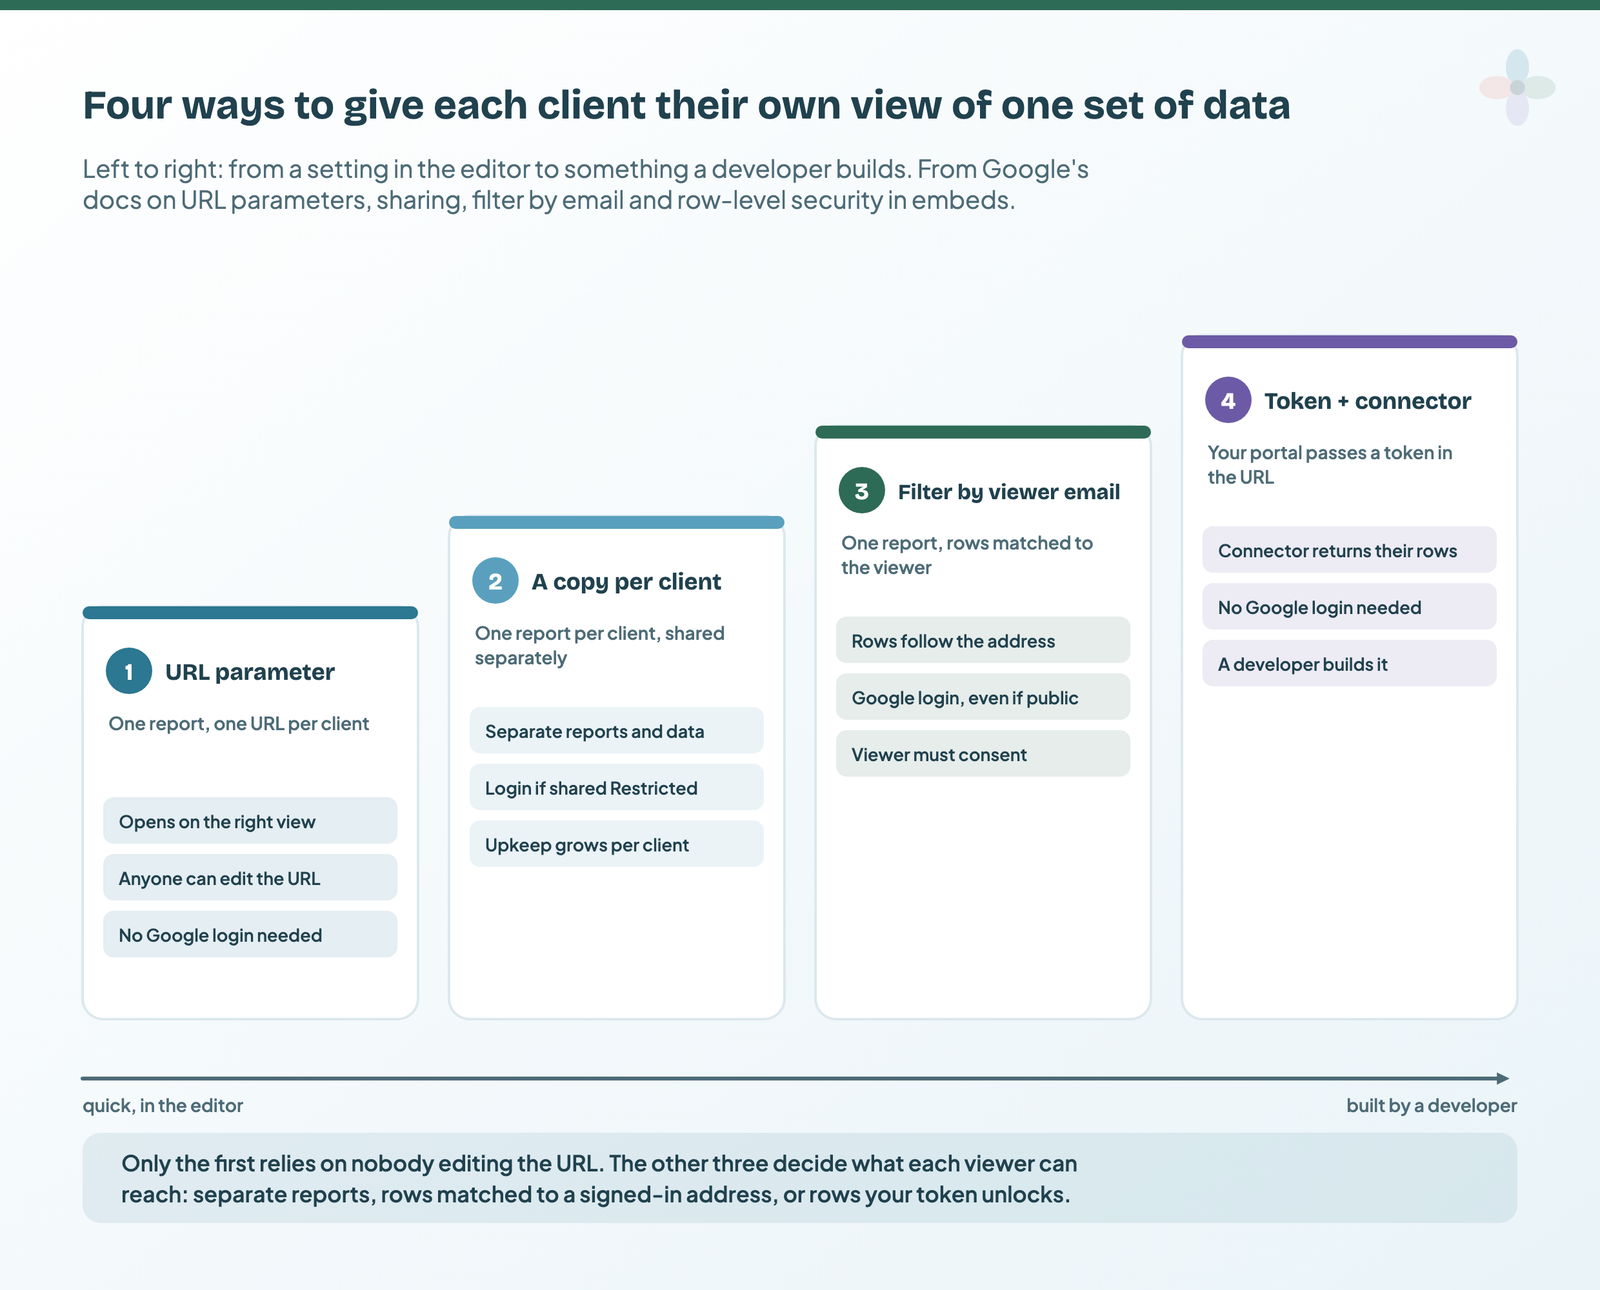
Filter by viewer email is where I’d start for most agencies; viewers must be signed in even if the report is public, must consent, and the address case must match. My row-level security guide covers the setup. A copy per client scales with the Linking API, or by hand with copying a template.
The token route is Google’s developer pattern for portals without Google sign-in: your app generates a unique, ideally short-lived token per logged-in user and passes it through the embed URL; a community connector turns it into filter values; the token setting is allowed to be modified by viewers; and the report is shared with selected users or by link with embedding on. Google also says to make sure an invalid token returns no data. It’s described in Google’s embedded row-level security guide. None of the four is listed as a Pro feature in the Google pages I read.
Privacy checks before a public embed goes live
A public or Unlisted link exposes more than the charts on your page. Seven checks:
- Use a reusable data source, not one embedded in the report. Google: sharing a report by public link makes its embedded data sources accessible to anyone with the link. (Embedded here means stored inside the report; embedded vs reusable sources explains the two meanings.)
- Keep only the fields the page needs in the data source.
- Disable download, print and copy for viewers. In the sharing settings, tick “Disable options to download, print, and copy for viewers”. Workspace admins can override it.
- Share Unlisted unless the report must be findable.
- Check every page, not just the embedded one. The link at the bottom of the embed opens the report in Data Studio.
- No personal data in the data source. With owner’s credentials, everyone who can open it sees what you see.
- Know the off switch: File > Embed report, untick Enable embedding.
The checklist is also in the companion Sheet, and sharing by link covers what each setting exposes.
Fresh numbers on a busy page or a wall screen
Viewers can’t refresh an embed. It updates when the data source’s freshness window expires, and freshness works the same way for embedded and reusable sources. My post on data freshness covers each connector’s setting.
For a report on an office screen, Pro’s auto refresh (Resource > Manage auto refresh settings) reloads an open report every 5, 10, 15 or 30 minutes, every 1, 2, 4, 8 or 12 hours, or once a day. It needs an organisation with Pro, a Pro report and edit permission, and self-service Pro is for Google Workspace or Cloud Identity organisations. It doesn’t change the source’s freshness: if it fires more often, it gets cached results.
| Setting | Free or Pro | Who sets it | What it can’t do |
|---|---|---|---|
| Data freshness (per data source) | Free | Data source owner | Viewers can’t override it |
| Auto refresh | Pro | Report editor | Beat the freshness setting or force a cache refresh |
| Extracted data source | Free | Data source owner | Hold more than 100 MB; it updates on a schedule and has no freshness setting |
Host-page reload (<meta http-equiv="refresh">) |
Free | Whoever owns the web page | It reloads the page; the data is still bound by freshness |
On a high-traffic page, the source sets the limit. Google says there’s no hard limit on concurrent viewers: performance depends on the source, Sheets and third-party connectors are bound by their API rate limits, and very large audiences call for a phased rollout. GA4 reports are subject to the Analytics Data API’s concurrent-request quotas and can show “Exhausted concurrent requests quota”. A reusable source with owner’s credentials keeps refreshes to a single data source, and an extracted data source takes the load off the API, Google Sheets included. For BigQuery, Google points to BI Engine.
When the embed shows an error
| Symptom | Likely cause | Fix |
|---|---|---|
| “Can’t access report” or a sign-in prompt | The report is Restricted | Share Unlisted or Public, or have viewers sign in with an invited account |
| Blank frame | Embedding not enabled, or the normal share link pasted | Enable embedding and copy from the Embed dialog |
| “Refused to connect” in Google Sites | Permissions on content embedded inside the report (forum, January 2025) | Check the nested content’s sharing |
| Parameters ignored | Not allowed in the report URL, or the display name used instead of the URL parameter name | Tick “Allow to be modified in report URL”; use the ds0.… name |
| Frame blocked on your own site | Your site’s Content-Security-Policy frame-src doesn’t list the domain in your embed code |
Add that domain to frame-src |
| Works in a browser, not in the Notion app | Login required | Unlisted or Public, or open in a browser |
Where to go next
- Sharing and scheduling Data Studio reports: every other way to share
- Row-level security with filter by email: one report, each client sees their rows
- Data sources vs datasets: embedded vs reusable sources, and credentials
- Navigation menus that survive an embed
- Mobile-friendly reports: responsive vs freeform
Client-reporting templates to embed: Windsor.ai’s marketing agency report, Coupler.io’s agency dashboard and Chloe Christine’s SEO dashboard on the free GA4 and Search Console connectors.
Frequently asked questions
Can clients see an embedded report without a Google account?
Yes, if the report is shared Public or Unlisted. A Restricted report needs each viewer signed in to a Google account that has access.
Can I remove the Data Studio watermark from an embed?
No. Google says embedded reports always contain the watermark and the full-screen option, and they can’t be removed.
Can I embed just one chart?
Google’s embed works on a report or a page. My workaround: build a page that holds only that chart and embed that page.
Does an embedded report update automatically?
When the data source’s freshness window expires; viewers can’t force it. Pro’s auto refresh reloads an open report on a timer, still within the freshness setting.
Is it safe to put client data in a public embed?
Only data you’d be happy for anyone with the link to see. URL parameters don’t restrict access; filter by email, a copy per client or a token connector do.
What’s the difference between Data Studio embedding and Looker embedding?
Looker, Google’s separate enterprise BI product, has signed embedding for private embeds. Data Studio’s embed is public or Google-account based. Looker vs Looker Studio vs Data Studio explains the products.