
No, not the part that matters. In my view, from the evidence below, AI is taking the questions people used to click through a dashboard to answer, and the commentary people used to write under it. What it isn’t replacing is the agreed, checkable set of numbers that a team and a client look at together. If anything, the more of your answers come from Claude, ChatGPT or Gemini, the more you need a report to check them against.
“Dashboards are dead” gets written every few years. Versions from 2018 and 2021 still rank for “are dashboards dead”. This time there’s more behind it: official MCP servers, assistants that build their own charts, and a Google that says it has “no defined timeline” for an MCP server for its own reporting tool. This covers:
- what a marketing dashboard is actually for
- what assistants already do better
- what Google, Anthropic and the connector vendors shipped in 2025–26
- what search demand and forum threads say
- where the dashboard survives: the check layer
- what changes for agencies, and what I’d do this quarter
This is an opinion piece, and the opinions are mine. I run MLforSEO, where I teach machine learning and AI to marketers, and I build marketing reports. The evidence under the opinions is dated and checkable: Google’s Data Studio and BigQuery documentation and release notes, Anthropic’s and the connector vendors’ own pages, search-demand data I pulled from DataForSEO in September and October 2026, and Google’s Data Studio forum. I haven’t tested any product for this post; where the cluster’s how-to posts go deeper, I link to them. (Data Studio is the product called Looker Studio until April 2026.)
What a marketing dashboard is actually for
A dashboard does two jobs that get confused.
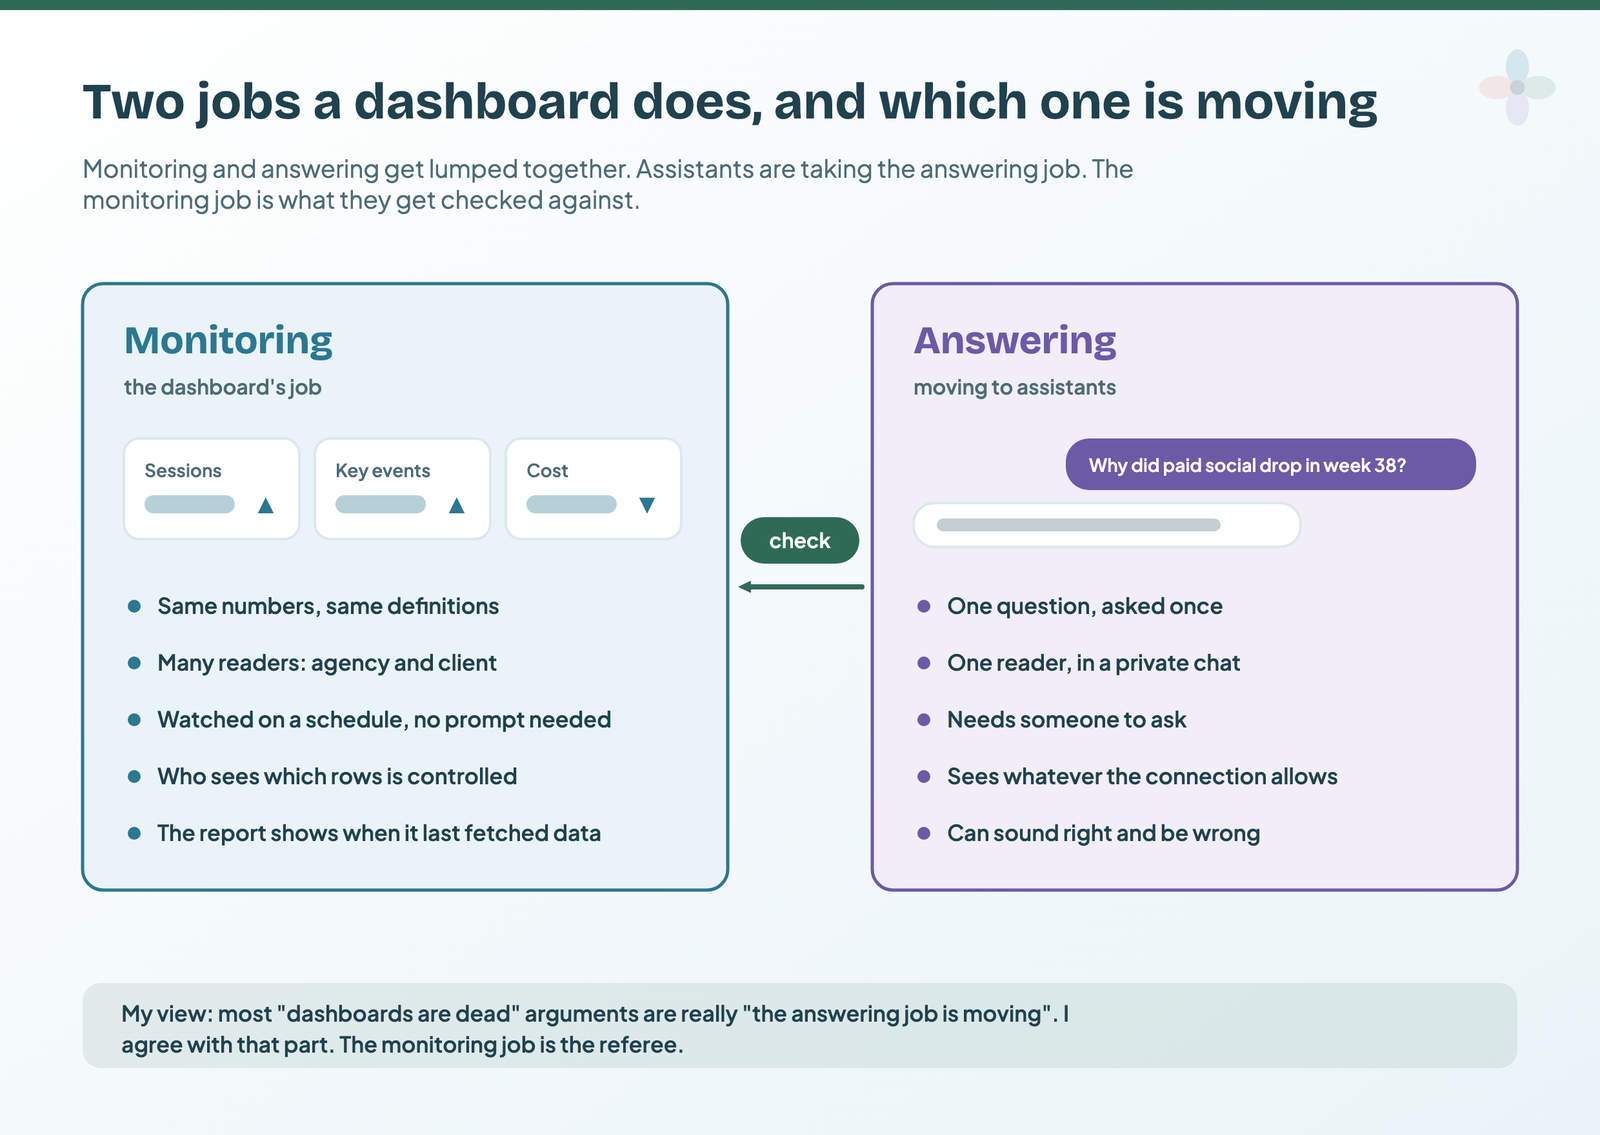
Monitoring is the same few numbers, with the same definitions, watched on a schedule by more than one person, without anyone having to ask. Answering is the one-off question: “why did paid social drop in week 38?”
Dashboards were always clumsy at answering. You hunt through filters, or you file a ticket with whoever built the report. They’re good at monitoring because they’re:
- shared: the client and the agency see the same view;
- governed: definitions are fixed, and filter by email gives each viewer only the rows carrying their address, free;
- checkable: each chart traces to a data source, and the report shows when it last fetched data (Google’s marketing connectors refresh every 12 hours by default).
Assistants are the reverse, in my view: quick at answering, with nothing shared, governed or stamped unless you build that in. And on the free version, monitoring depends on the report: Data Studio alerts are Pro-only, so the report plus a schedule is the monitoring.
| Job | A dashboard | An assistant | Who wins (my view) |
|---|---|---|---|
| Watch the same KPIs every week | Same view, no prompt needed | Has to be asked each time | Dashboard |
| Answer a one-off “why” | Filter hunting, or a ticket | Ask in a sentence, if it’s connected to the data | Assistant |
| Keep one definition of a “lead” | Fixed in the data source or a calculated field | Whatever the prompt says that day | Dashboard |
| Control who sees which client’s data | Sharing plus filter by email | Whatever the connection’s permissions allow | Dashboard |
| Explain a change in a sentence | A text box someone writes | A first draft in seconds, to be checked | Assistant |
| Show it to a client in a meeting | One link everyone opens | A private chat, re-run on the day | Dashboard |
| Spot something nobody asked about | Only if a chart already shows it | Only if someone asks | Neither, alone |
Most “dashboards are dead” arguments are really “the answering job is moving”. I agree with that part. It’s the difference between exploratory and explanatory work, and the explanatory view still has to pass the so-what test.
What assistants already do better than a dashboard
Three reporting jobs are worth handing to an assistant now, each with a caveat:
- Ad-hoc questions against the data under the report. Google’s GA4 MCP server is official, read-only and runs on your computer; its Google Ads server is read-only too; BigQuery has a Google-hosted MCP endpoint; and the six connectors I compared all run an MCP server. Inside GA4, Ask Advisor answers “why” questions from that property’s data (Beta, English-language properties). Caveat: the assistant reads the source, not your report.
- Narrative. A first draft of the monthly commentary, from numbers you give it. My method is numbers only, a fixed structure and a line-by-line check. Caveat: it will offer causes nobody has checked.
- Build help. Calculated fields, regex and page plans. Caveat: it invents functions Data Studio doesn’t have.
Google’s own documentation carries the warning that applies to all three: Gemini for Google Cloud “can generate output that seems plausible but is factually incorrect”, and Google recommends validating all output. There’s also no Data Studio MCP server, so the assistant can’t open the report to check itself. In my view, for answering, assistants already beat filtering a dashboard, and I tell my students to use them for exactly that. Checking is a separate job.
The evidence: what Google, Anthropic and the connectors shipped in 2025–26
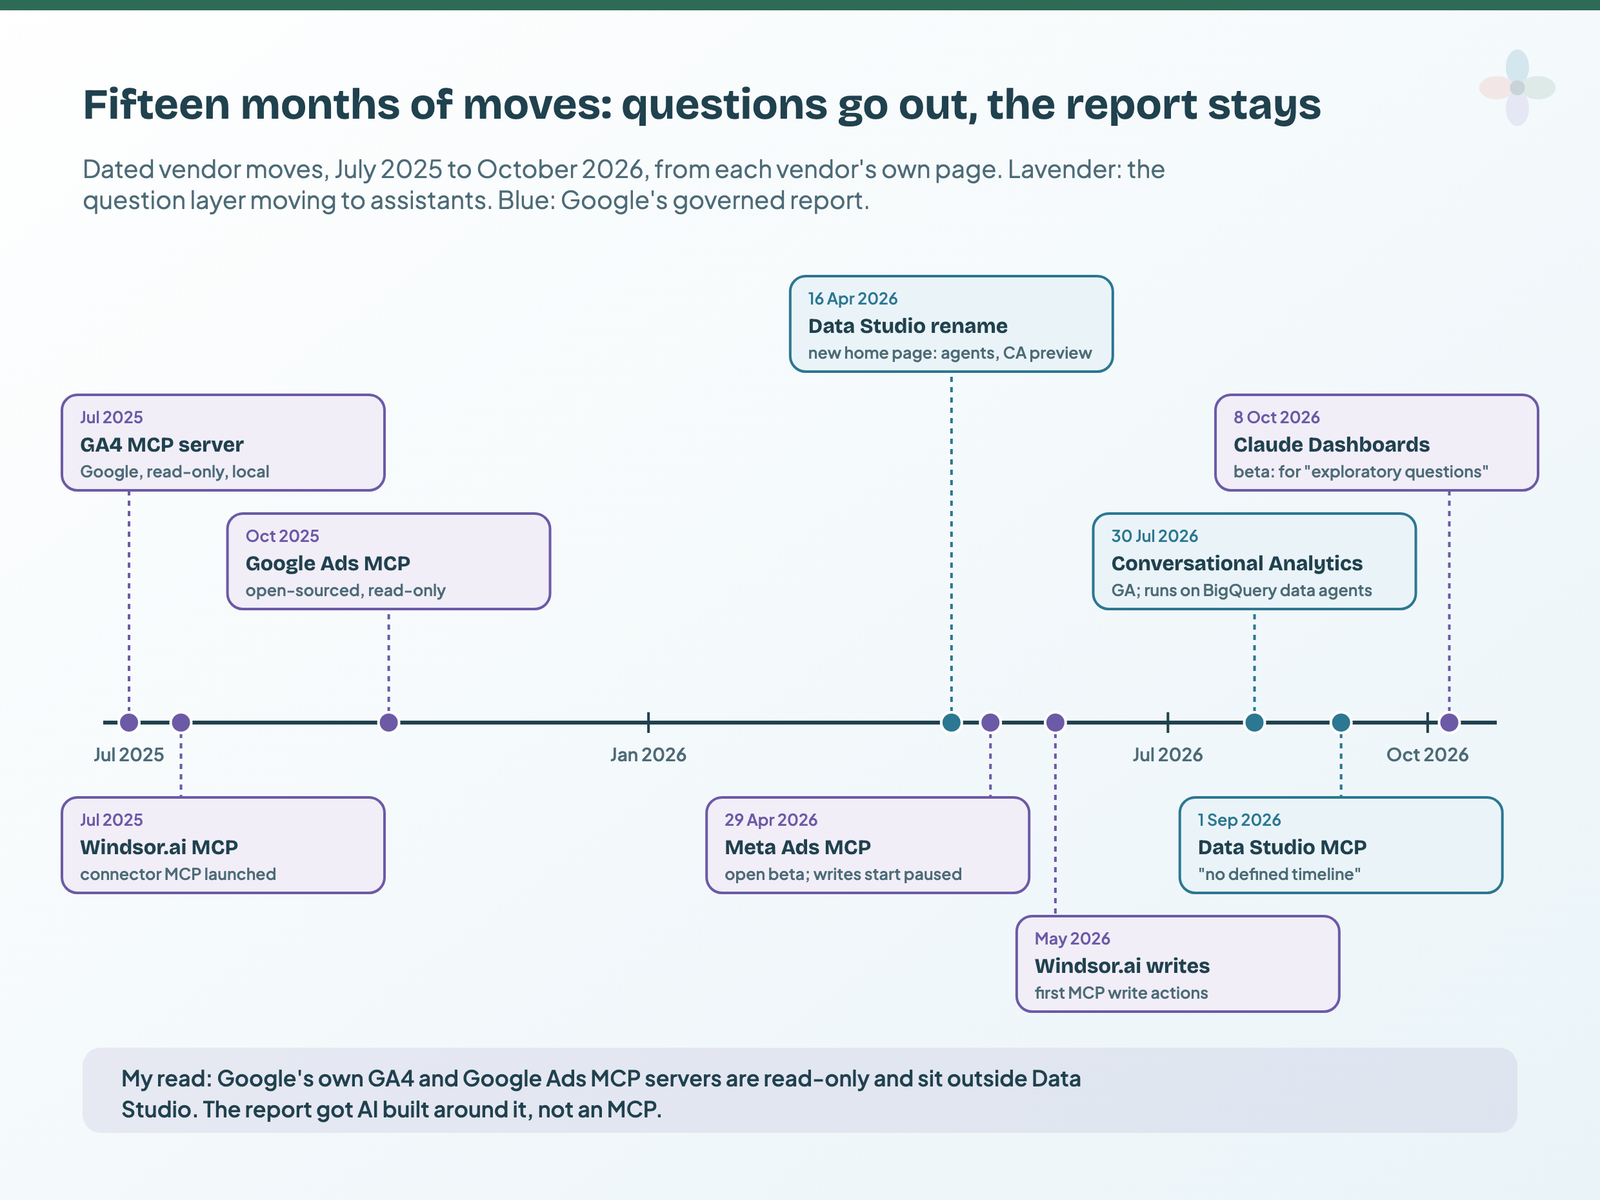
My read of the moves, taken together: questions go to assistants, the governed view stays.
| Date | Who | What shipped | What it says (my read) |
|---|---|---|---|
| Jul 2025 | Google Analytics MCP server: official, read-only, local | Questions about GA4 can go to an assistant | |
| Jul 2025 | Windsor.ai | Windsor MCP launched | Connectors become the assistant’s data route |
| Oct 2025 | Google Ads MCP server open-sourced, read-only | Same, for paid search | |
| 16 Apr 2026 | Looker Studio renamed Data Studio; new home page with BigQuery conversational agents; new Conversational Analytics (preview) for all users | AI goes around the report, through BigQuery | |
| 29 Apr 2026 | Meta | Official Ads MCP server, open beta; created ads start paused | Assistants start to act, not just read |
| May 2026 | Windsor.ai | First MCP write actions | Same, through a connector |
| 30 Jul 2026 | Conversational Analytics generally available | Governed Q&A, defined by whoever builds the agent | |
| 1 Sep 2026 | An MCP server for Data Studio: “no defined timeline” | The report itself stays closed to assistants | |
| 8 Oct 2026 | Anthropic | Claude Dashboards, beta on paid plans | Even AI-built dashboards come with the query and a freshness stamp |
Checked against each vendor’s own page on 14 October 2026. Windsor.ai dates from its changelog.
Google. Its product page now calls Data Studio “the discovery page for Data Cloud resources in the AI era”, connecting to more than 1,400 data sources. Conversational Analytics is open to every Data Studio user, but only through a BigQuery data agent that someone builds in BigQuery (set-up here). Open to every user isn’t free to run: each question is a BigQuery query (billed after a free 1 TiB a month), and conversations with the agents are billed in data tokens from 1 January 2027. Gemini itself, inside Data Studio, is two Pro-only features in Preview (the full inventory is in my AI in Data Studio guide). And on the forum, a Google staff member wrote on 1 September 2026: “due to shifts in strategic priorities, there is currently no defined timeline for the development of an MCP server for Data Studio.” The same wording is in my Data Studio API post.
The connectors. Windsor.ai, Porter Metrics, Coupler.io and Catchr include their MCP on every plan, and Funnel on all three of its plans; Supermetrics’ standalone server needs Data API access. Several now write: Windsor.ai lists 139 write actions across 19 connectors, Supermetrics’ writes are in Beta with campaigns always created paused, and Meta’s official server creates ads paused.
Anthropic. Claude Dashboards connects to a warehouse such as BigQuery. Anthropic says they “work well for quick, exploratory questions”, work “alongside your BI and analytics tools”, and that each chart shows its query and when its data was last refreshed. My read: even the company shipping AI-built dashboards frames them as the answering tool and builds the check in.
The forecasts you’ll see quoted in other pieces cite no source I could open, so I’ve left them out.
What search demand says: how-to searches fell, dashboard searches didn’t
In a year, Data Studio how-to searches fell sharply while dashboard and MCP searches grew.
| Keyword | Sep 2025 | Aug 2026 | Change |
|---|---|---|---|
| looker studio tutorial | 390 | 50 | −87% |
| looker studio templates | 720 | 90 | −87% |
| looker studio calculated field | 70 | 10 | −86% |
| looker studio ai | 140 | 10 | −93% |
| looker studio dashboard | 720 | 1,000 | +39% |
| google analytics mcp | 320 | 1,000 | about 3× |
| google ads mcp | 260 | 1,900 | about 7× |
| google search console mcp | 110 | 1,000 | about 9× |
| claude dashboards | 0 | 210 | from zero |
| marketing dashboard | 1,300 | 480 | −47% (3-month averages) |
Google Ads monthly search volume, US, via DataForSEO, pulled 29 September, 13 October and 14 October 2026. Change is month against month unless noted.
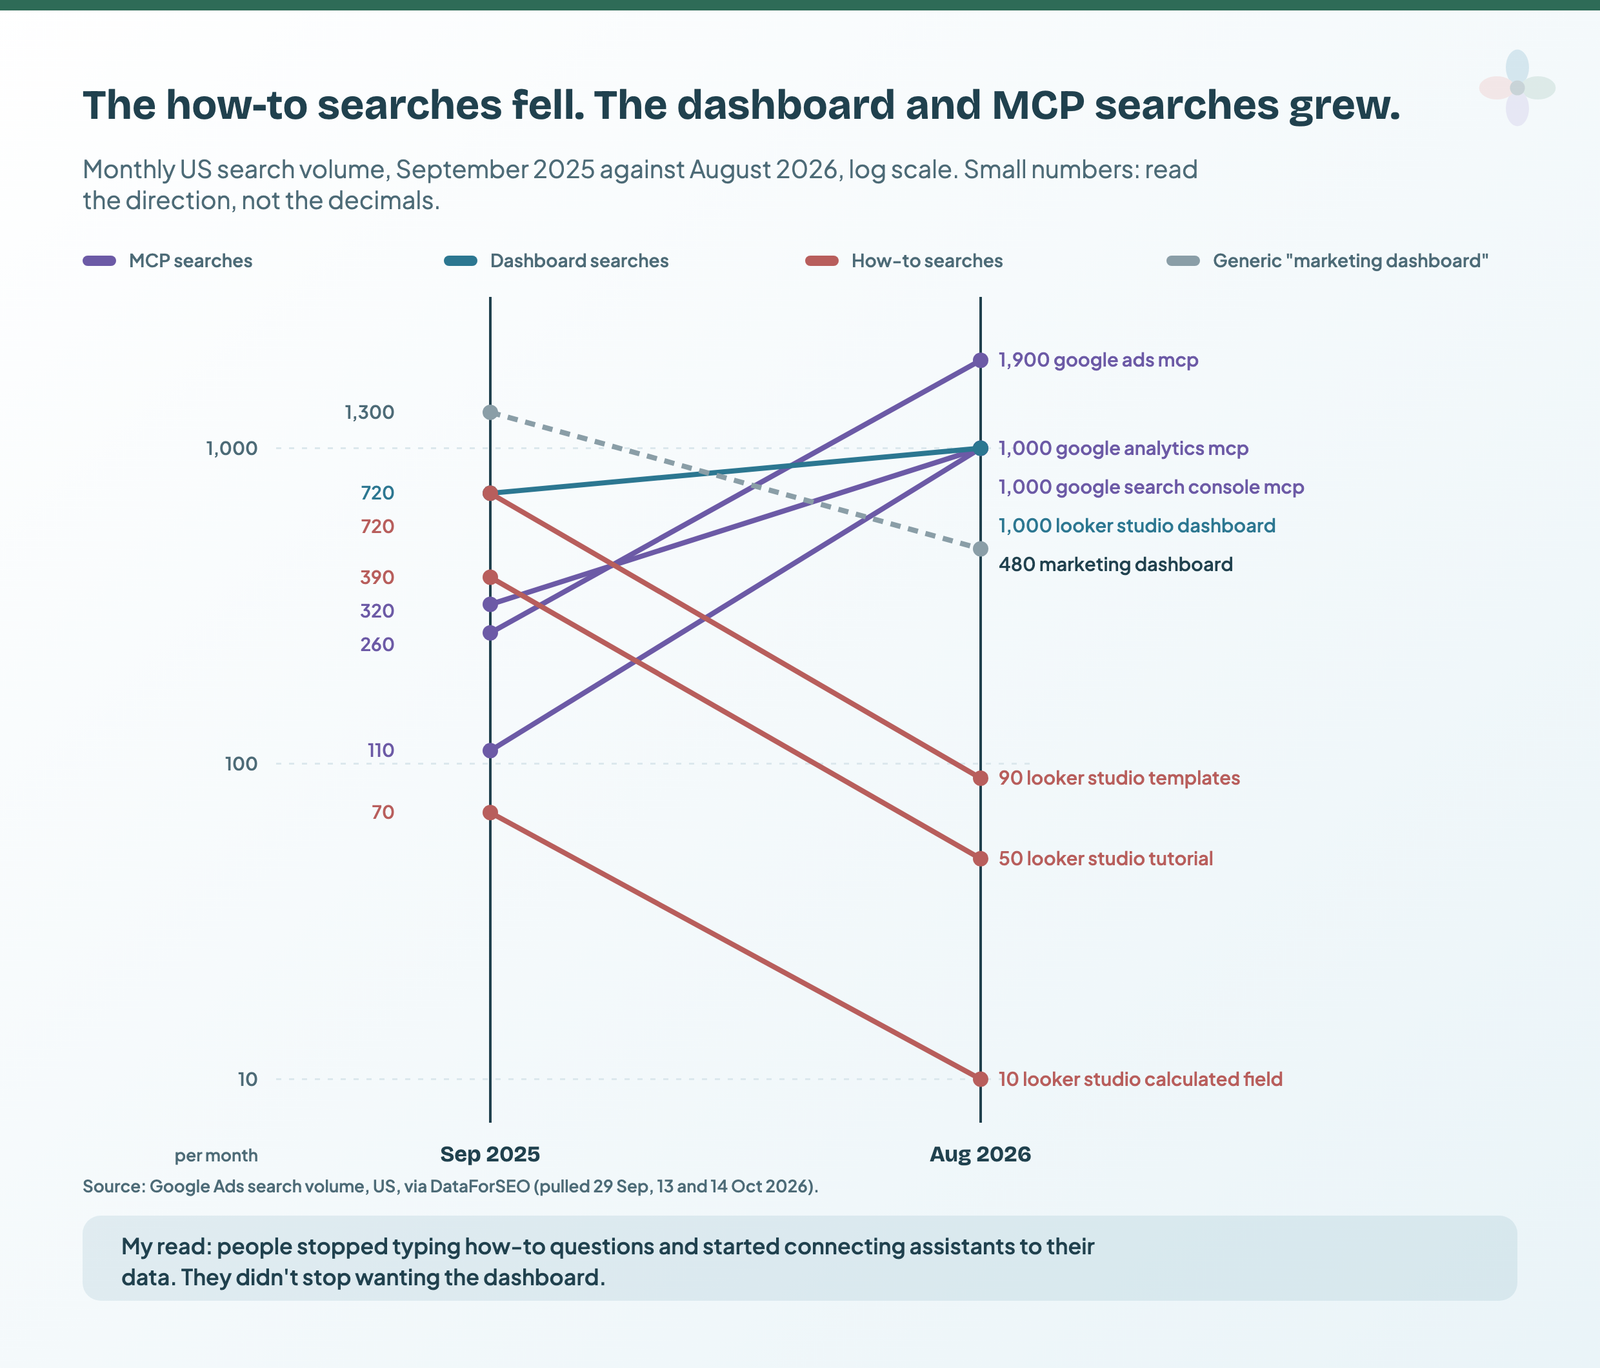
“claude dashboards” was already at 210 a month before Anthropic’s product existed. The honest counterpoint: generic “marketing dashboard” fell 47%. My read is that people stopped typing how-to questions, because an assistant answers them, and started connecting assistants to their data. They didn’t stop wanting the dashboard.
How much weight this bears: not a lot. The volumes are small, Google Ads volumes understate long-tail informational demand and group near-synonyms, and September to August catches a seasonal trough, so the decline is probably overstated. The direction is the signal.
What people actually ask for: AI on top of the dashboard
On Google’s Data Studio forum, only 13 of 444 Q&A topics since October 2025 were about AI, about 3%. The most-viewed is a thread asking for a Data Studio MCP server, and every request in it is for AI to work on the dashboard: create and edit reports from Claude Code, manage data sources across many reports, and read the charts. One user wanted to:
“automate LLM reviews of the data e.g. monthly reviews of the dashboard”
Data Studio forum, 7 July 2026
A Google staff member replied “Noted, and fully agree”, two months before the “no defined timeline” answer.
Reddit has threads on the same question (r/analytics asked in July 2026 whether anyone’s company is replacing dashboards with apps made by AI). I only saw them in search results and couldn’t open them from my research setup, so I’m not summarising or counting them. My read of the forum: users want the assistant reading the report, which is the opposite of replacing it. The commentary job they describe is the one in my AI commentary guide.
Where the dashboard survives: the check layer
When Claude tells you organic sessions were, say, 12,400 last month, how do you know? You open the Data Studio chart with the same property, metric, dimension and fixed date range. Google’s GA4 MCP server and Data Studio’s GA4 connector both ask the GA4 Data API, so they should agree. When they don’t, the cause is usually findable: the date range, the time zone, sampling or thresholds, the “(other)” row, or an invented metric name (GA4 has key events; it has no metric called “conversions”).
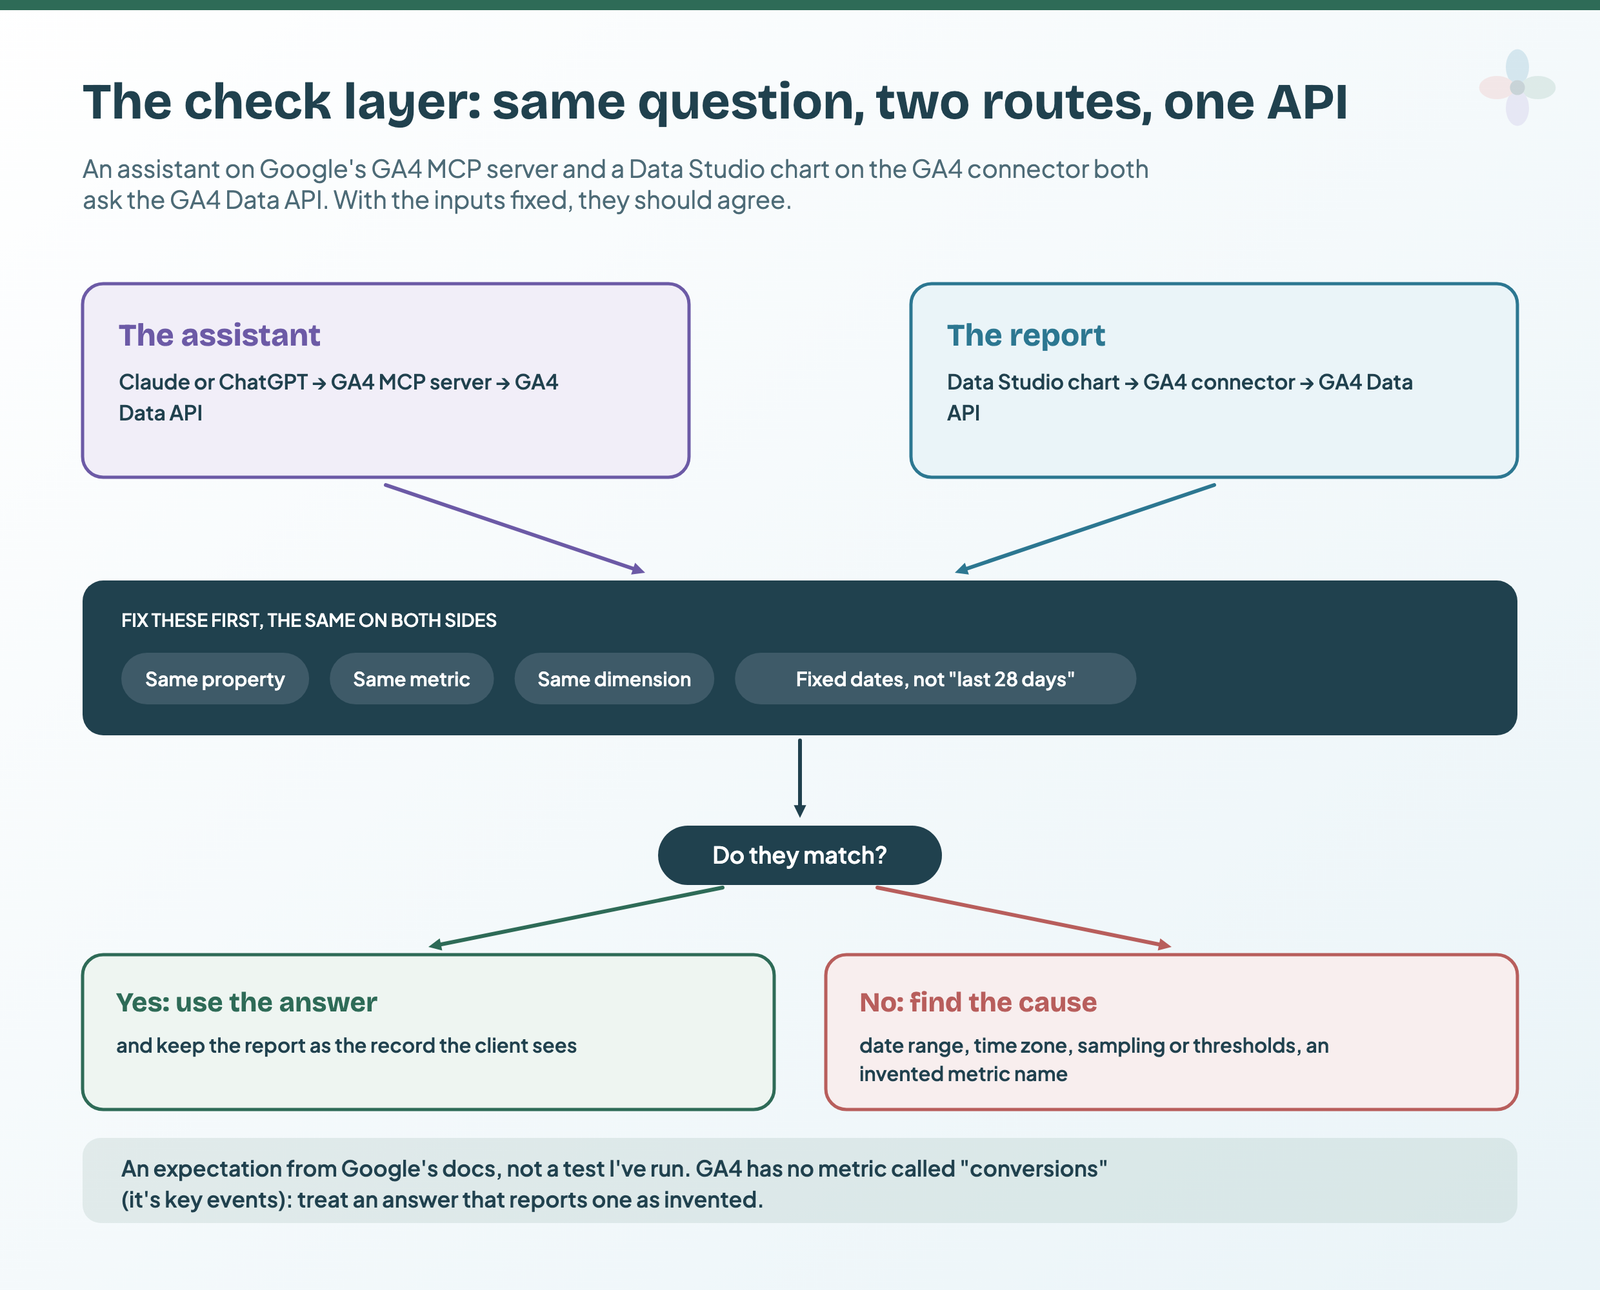
The step-by-step versions are in the GA4 parity check, the Google Ads and Search Console one and the connector MCP one. Anthropic built the same idea into Claude Dashboards: every number shows its query and when its data was refreshed. Google’s own AI Overview for “are dashboards dead” (14 October 2026) calls the dashboard “a visual governance and human-verification layer”. I’d put it more plainly: the report is the referee.
A report you can check an assistant against has:
- ☐ one written definition per metric, on the report itself
- ☐ fixed date ranges for anything you’ll compare
- ☐ the “data last updated” stamp visible
- ☐ the right people seeing the right rows
- ☐ a GA4 data source on the same property the assistant reads
My view on “the future of dashboards”: fewer pages, and every one of them something you’d be happy to check an assistant against. Chapter 5 of my ebook, Data Storytelling in Data Studio, is the test I use to decide which pages make that cut.
What changes for agencies
Little of this needs new software. Most of it is process. All six rows are my view, each tied to something checkable.
| Reporting task | How it’s often done now | What I’d change in 2026 | Read next |
|---|---|---|---|
| Report pages | One per client, then one per channel, then the “just in case” pages | Keep the monitoring core; retire pages nobody opens | Track report usage |
| Monthly commentary | Written from scratch each month | Assistant drafts from numbers you supply; checked line by line against the report | AI commentary |
| Ad-hoc client questions | A new chart, or an analyst’s afternoon | An assistant connected read-only, with the report as referee | MCP servers compared |
| Client data rules | Whatever each person’s ChatGPT account does | Plan, contract and scopes decided before anything is connected | Client data checks |
| Write-capable MCPs | Often not discussed yet | A change-control decision: who may let an assistant pause a campaign | Read or write |
| What you sell | “We built the dashboard” | “We stand behind these numbers” | Reporting operations |
The first row matters most. If you can’t say which report pages anyone still opens, find out first (Data Studio usage can be tracked), because a page nobody opens is a page nobody checks. The delivery side stays in Data Studio: automated client reporting still does the monitoring job well.
What I’d do this quarter
- Audit your report pages. Mark each one “monitoring” or “answering”; merge or cut the answering ones.
- Write the metric definitions onto the report. A text box per page is enough.
- Pick one read-only assistant route, Google’s GA4 server or your connector’s MCP, and run the parity check on one client.
- Try AI-drafted commentary on one report, with the verification pass, before it goes anywhere near the client.
- Write the client-data rule before anyone connects a client account.
To keep track of which AI features exist, on which plan, use the feature tracker in my AI in Data Studio guide. The takeaway in one line: let the assistant answer, and let the report decide whether the answer was right. No doom required.
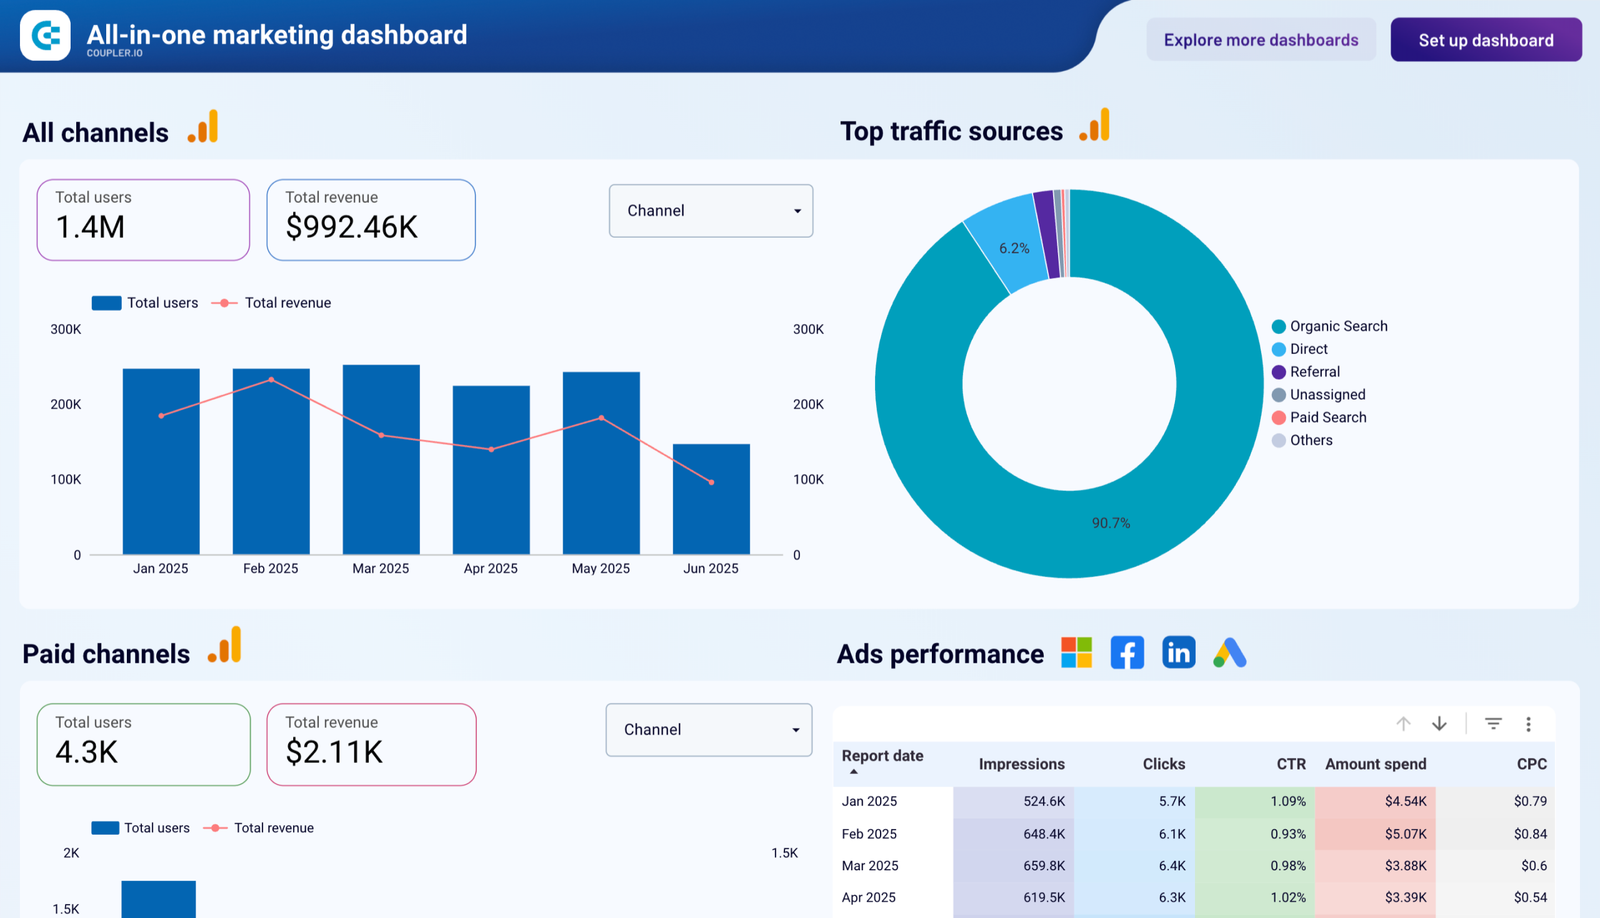
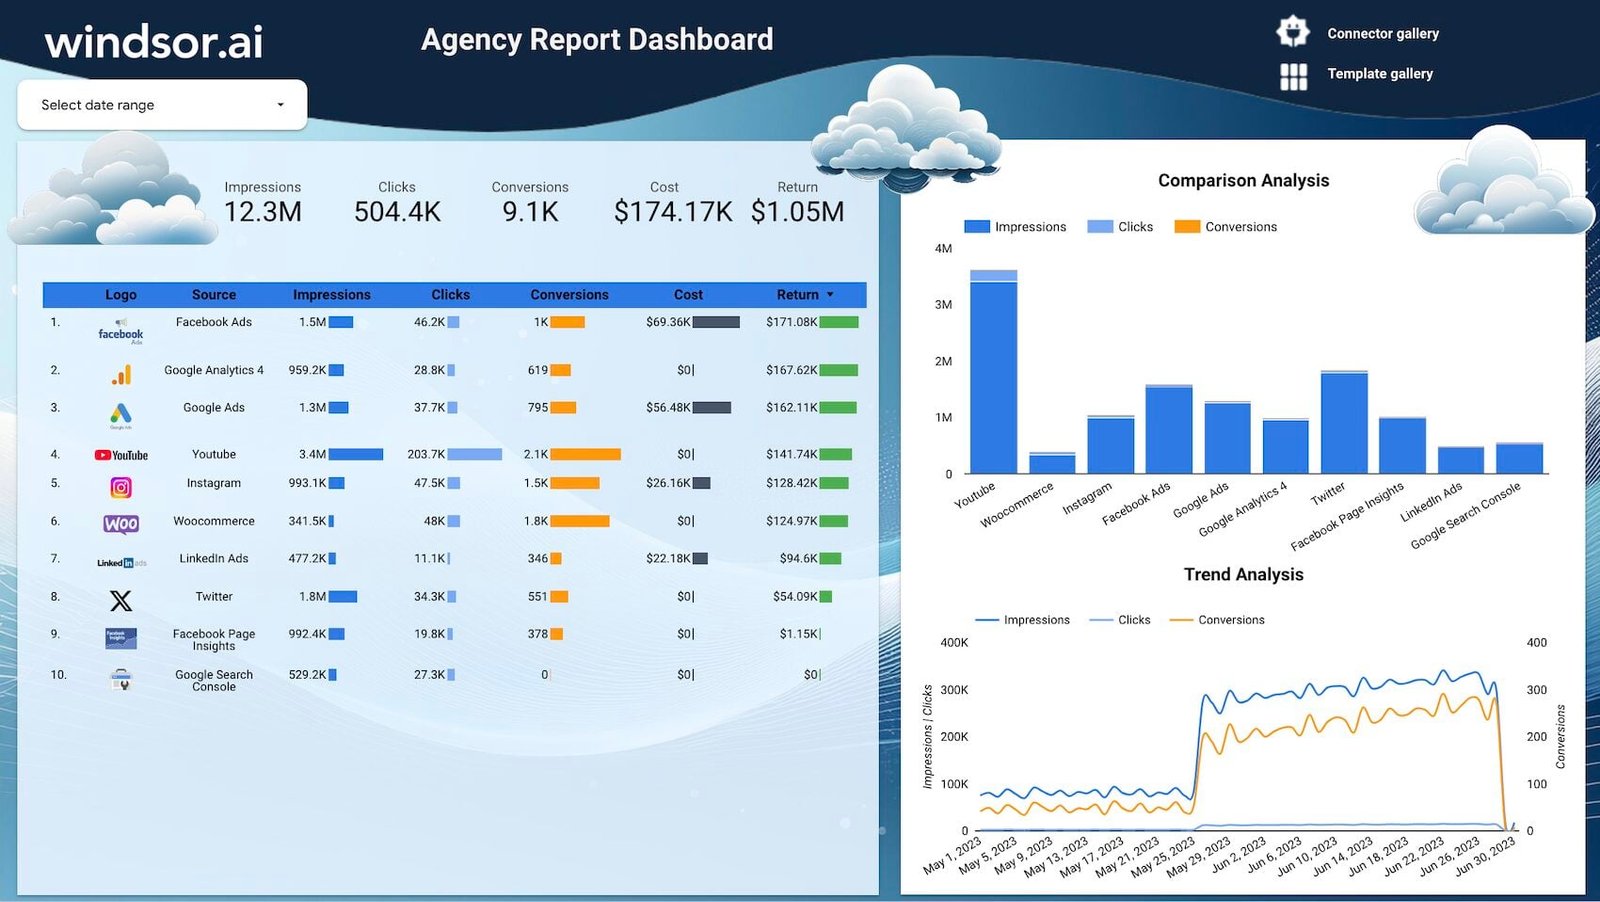
Two free agency templates for the monitoring core
If you’re rebuilding the monitoring core, start from a template rather than a blank page.
Where to go next
- AI in Data Studio: what Gemini does, what’s free, and what to use instead
- Connect GA4 to Claude or ChatGPT, and check it against your Data Studio report
- Marketing data MCP servers compared
- Writing client report commentary with AI, without making things up
- Sending client data to ChatGPT, Claude or Gemini: what agencies check first
- Data Studio vs Power BI vs Tableau
Frequently asked questions
Are dashboards dead?
No. The answering job is moving to assistants. The shared, monitored view isn’t going anywhere, and it’s what you check AI answers against.
Will AI replace Data Studio?
Not on the evidence. Google is building AI around it (Conversational Analytics through BigQuery, Gemini on Pro) and has no defined timeline for a Data Studio MCP server.
Can Claude or ChatGPT build a Data Studio dashboard?
Not inside Data Studio: there’s no MCP server, and the Data Studio API can’t create reports. Claude Dashboards builds its own dashboards from a warehouse such as BigQuery, in beta on paid plans.
Can an assistant read my Data Studio report?
No. Connect it to the same data (GA4, Google Ads, BigQuery or a connector’s MCP) and compare its answer with the report.
Should my agency stop building dashboards?
In my view, build fewer pages, keep the monitoring core, and make each page something you’d check an assistant against.
Some links in this post are affiliate links: if you sign up through one, I may earn a commission at no extra cost to you. How I work with partners.