
For marketing reporting that mostly runs on Google data and goes to people outside your team, Data Studio is the cheapest of the three to run, because nobody pays to build or to read a report. Power BI and Tableau are the stronger tools when you need a real data model, governed metrics or very large datasets, and Power BI Pro is already included in Microsoft 365 E5.
Data Studio is Google’s free reporting tool, called Looker Studio from 2022 until Google renamed it back in April 2026, so most comparisons you’ll find still use the old name. This one covers what each tool costs to build and to share at different audience sizes, which marketing sources each connects to on its own, data modelling, freshness, performance, AI features, what more than 24,000 ratings and a coded sample of reviews say, and four priced scenarios: a freelancer, an agency, an in-house team and an enterprise BI setup.
Price your own setup. The reporting cost calculator runs these numbers for your clients, platforms and billing, with every route side by side.
The verdict: which tool wins which job
No tool wins every row. The deciding question is usually who reads the report, not what the dashboard can do.
| Your situation | Best fit | Why |
|---|---|---|
| Freelancer reporting to a few clients | Data Studio | No licence for you or your clients; GA4, Google Ads and Search Console connect natively |
| Agency sending monthly client reports | Data Studio | Readers are free at any number; Pro ($9 per builder) if reports must belong to the agency, not a person |
| In-house team in a Microsoft 365 E5 company | Power BI | Pro is already included, so the per-reader cost is mostly paid |
| Marketing data joined to finance, CRM or product data in one model | Power BI | Relationships, DAX measures and Power Query; Data Studio blends stop at five tables |
| Analyst-led visual exploration | Tableau | Visual analysis is its most-praised strength in reviews (14 of 20 recent ones) |
| Salesforce or Marketing Cloud shop | Tableau | Native Salesforce, Marketing Cloud Intelligence and Data 360 connectors |
| Hundreds of readers, governed metrics and data access permissions | Power BI or Tableau (or Looker) | Capacity licensing and data management; Data Studio has no semantic layer |
| Very large datasets (well beyond a 100 MB extract) | Power BI Premium Per User, or Data Studio on BigQuery | PPU models run to 100 GB; Data Studio reads BigQuery live instead of extracting it |
All three at a glance
Prices from each vendor’s own pricing page, checked 13 October 2026, per user per month and billed annually unless stated.
| Data Studio | Power BI | Tableau | |
|---|---|---|---|
| Made by | Microsoft (sold inside Microsoft Fabric) | Salesforce | |
| What it is | Browser-based reporting and dashboards | BI platform: Desktop app plus cloud service | Visual analytics platform: Cloud, Server, Desktop |
| Free tier | Yes: build and share, no time limit | Free account: build, can’t share | Desktop Free Edition: local files only |
| Cost to build | $0 · Pro $9 per user per project | Pro $14 · Premium Per User $24 | Creator $75 (Standard) · $115 (Enterprise) |
| Cost per reader | $0, Pro reports included | $14 each on Pro, unless content sits on F64/P1 capacity | Viewer $15 (Standard) · $35 (Enterprise) |
| Editing without full authoring | Editor access, free | Pro licence | Explorer $42 (Standard) · $70 (Enterprise) |
| Contract | None on the free tier; Pro billed monthly per licence | Pro and PPU “paid yearly” | Annual contract, at least one Creator |
| Authoring | Browser only | Power BI Desktop (Windows) plus web | Desktop, Prep Builder, web authoring |
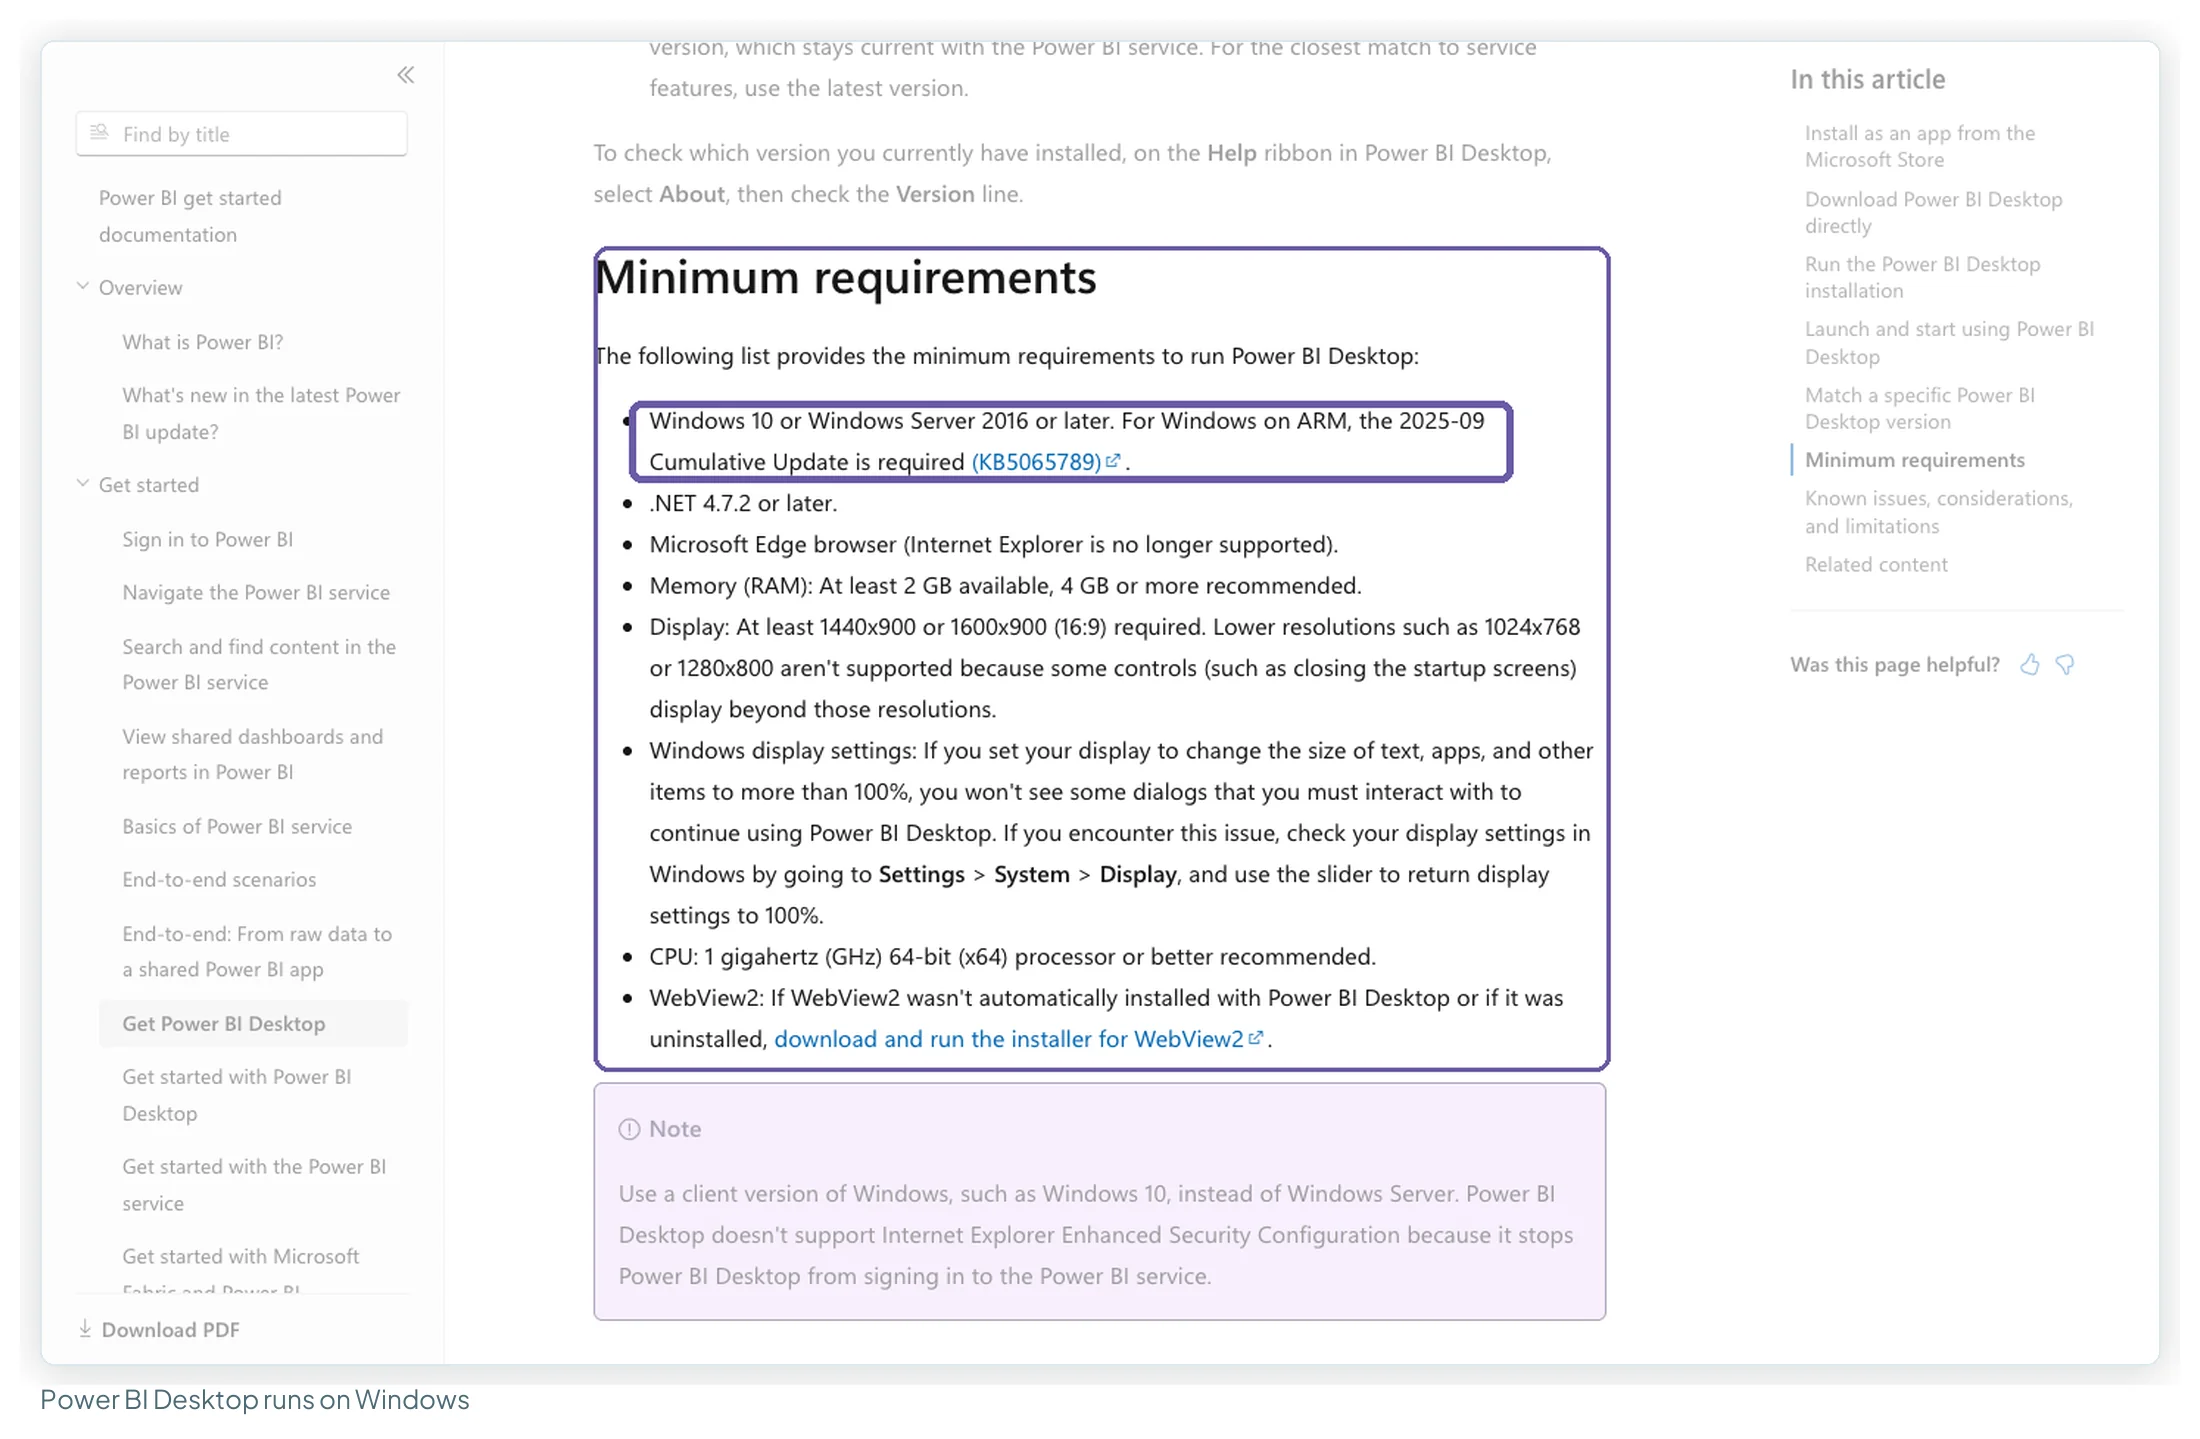
| Mac | Yes (browser) | Desktop needs Windows 10 or later | Desktop runs on Windows and Mac; web authoring in the browser |
| GA4 | Native | Native (“Google Analytics”, Implementation 2.0) | Native (“Google Analytics 4”) |
| Google Ads, Search Console | Native | Not in Microsoft’s connector index | Not in Tableau’s supplied list |
| Meta, LinkedIn, TikTok Ads | Partner connectors (third-party, mostly paid) | Third-party connector or warehouse | Third-party connector or warehouse |
| Sources claimed | “More than 1,400”; 23 built by Google | Connector index A–Z, no total stated | 94 supplied entries, about 83 active |
| Data modelling | Calculated fields; blends of up to 5 tables | Semantic models, relationships, DAX, Power Query | Relationships, joins, LOD calculations |
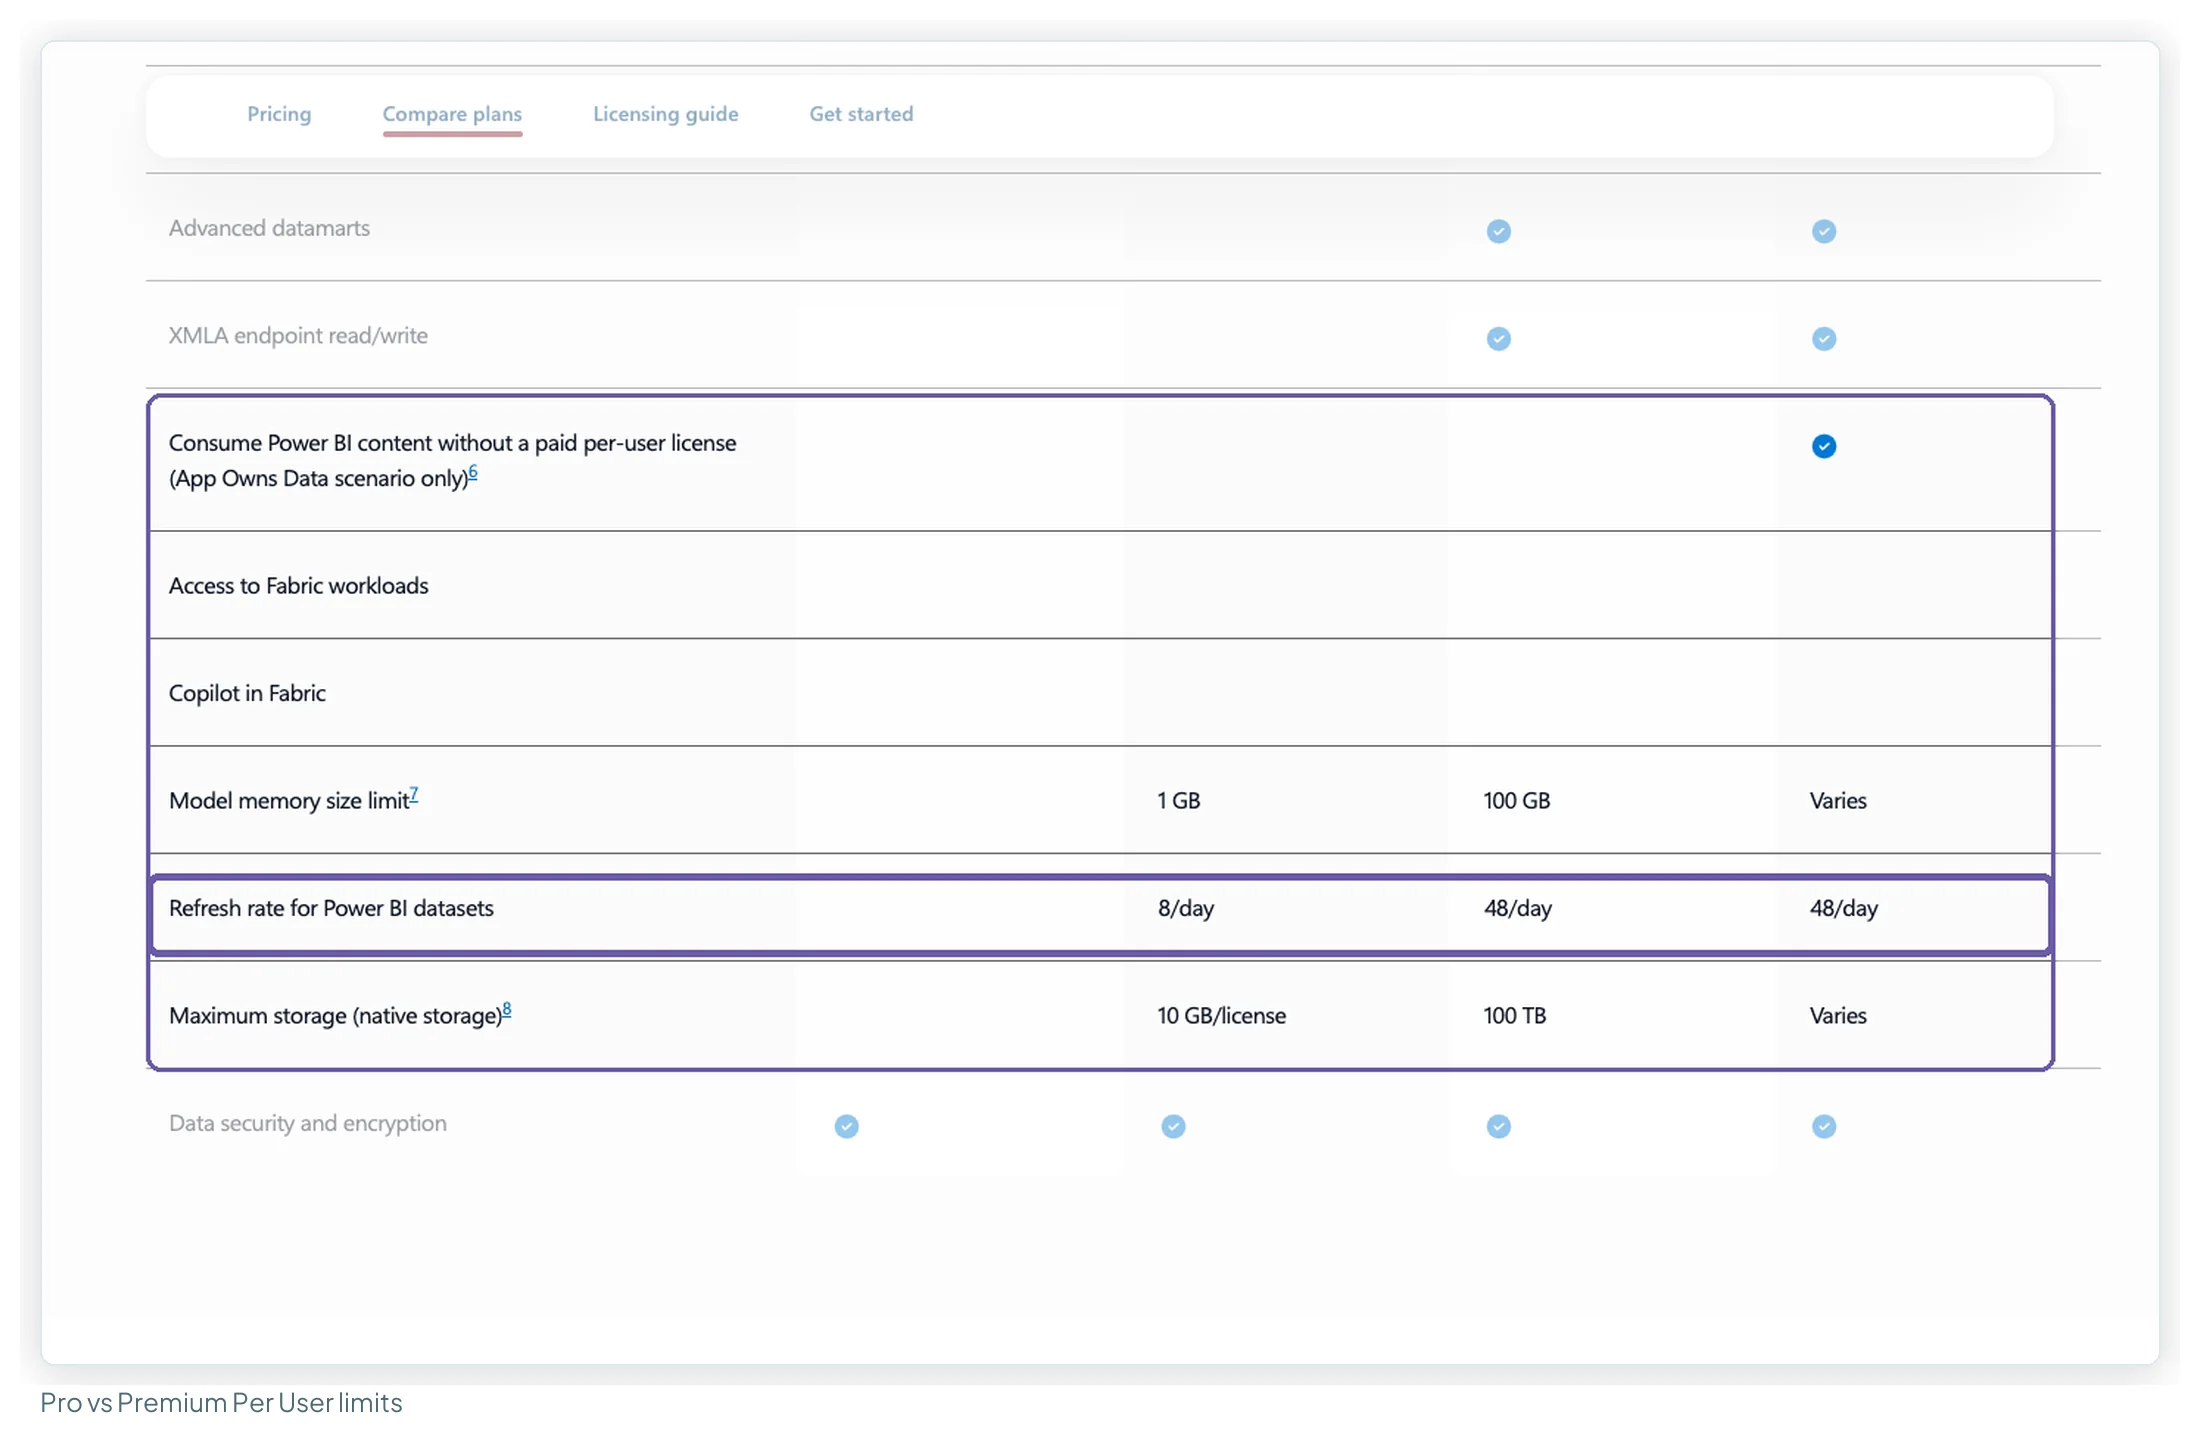
| Size limit | Extracts up to 100 MB; live sources (e.g. BigQuery) otherwise | Model 1 GB (Pro) · 100 GB (PPU) | Not stated on the pricing pages |
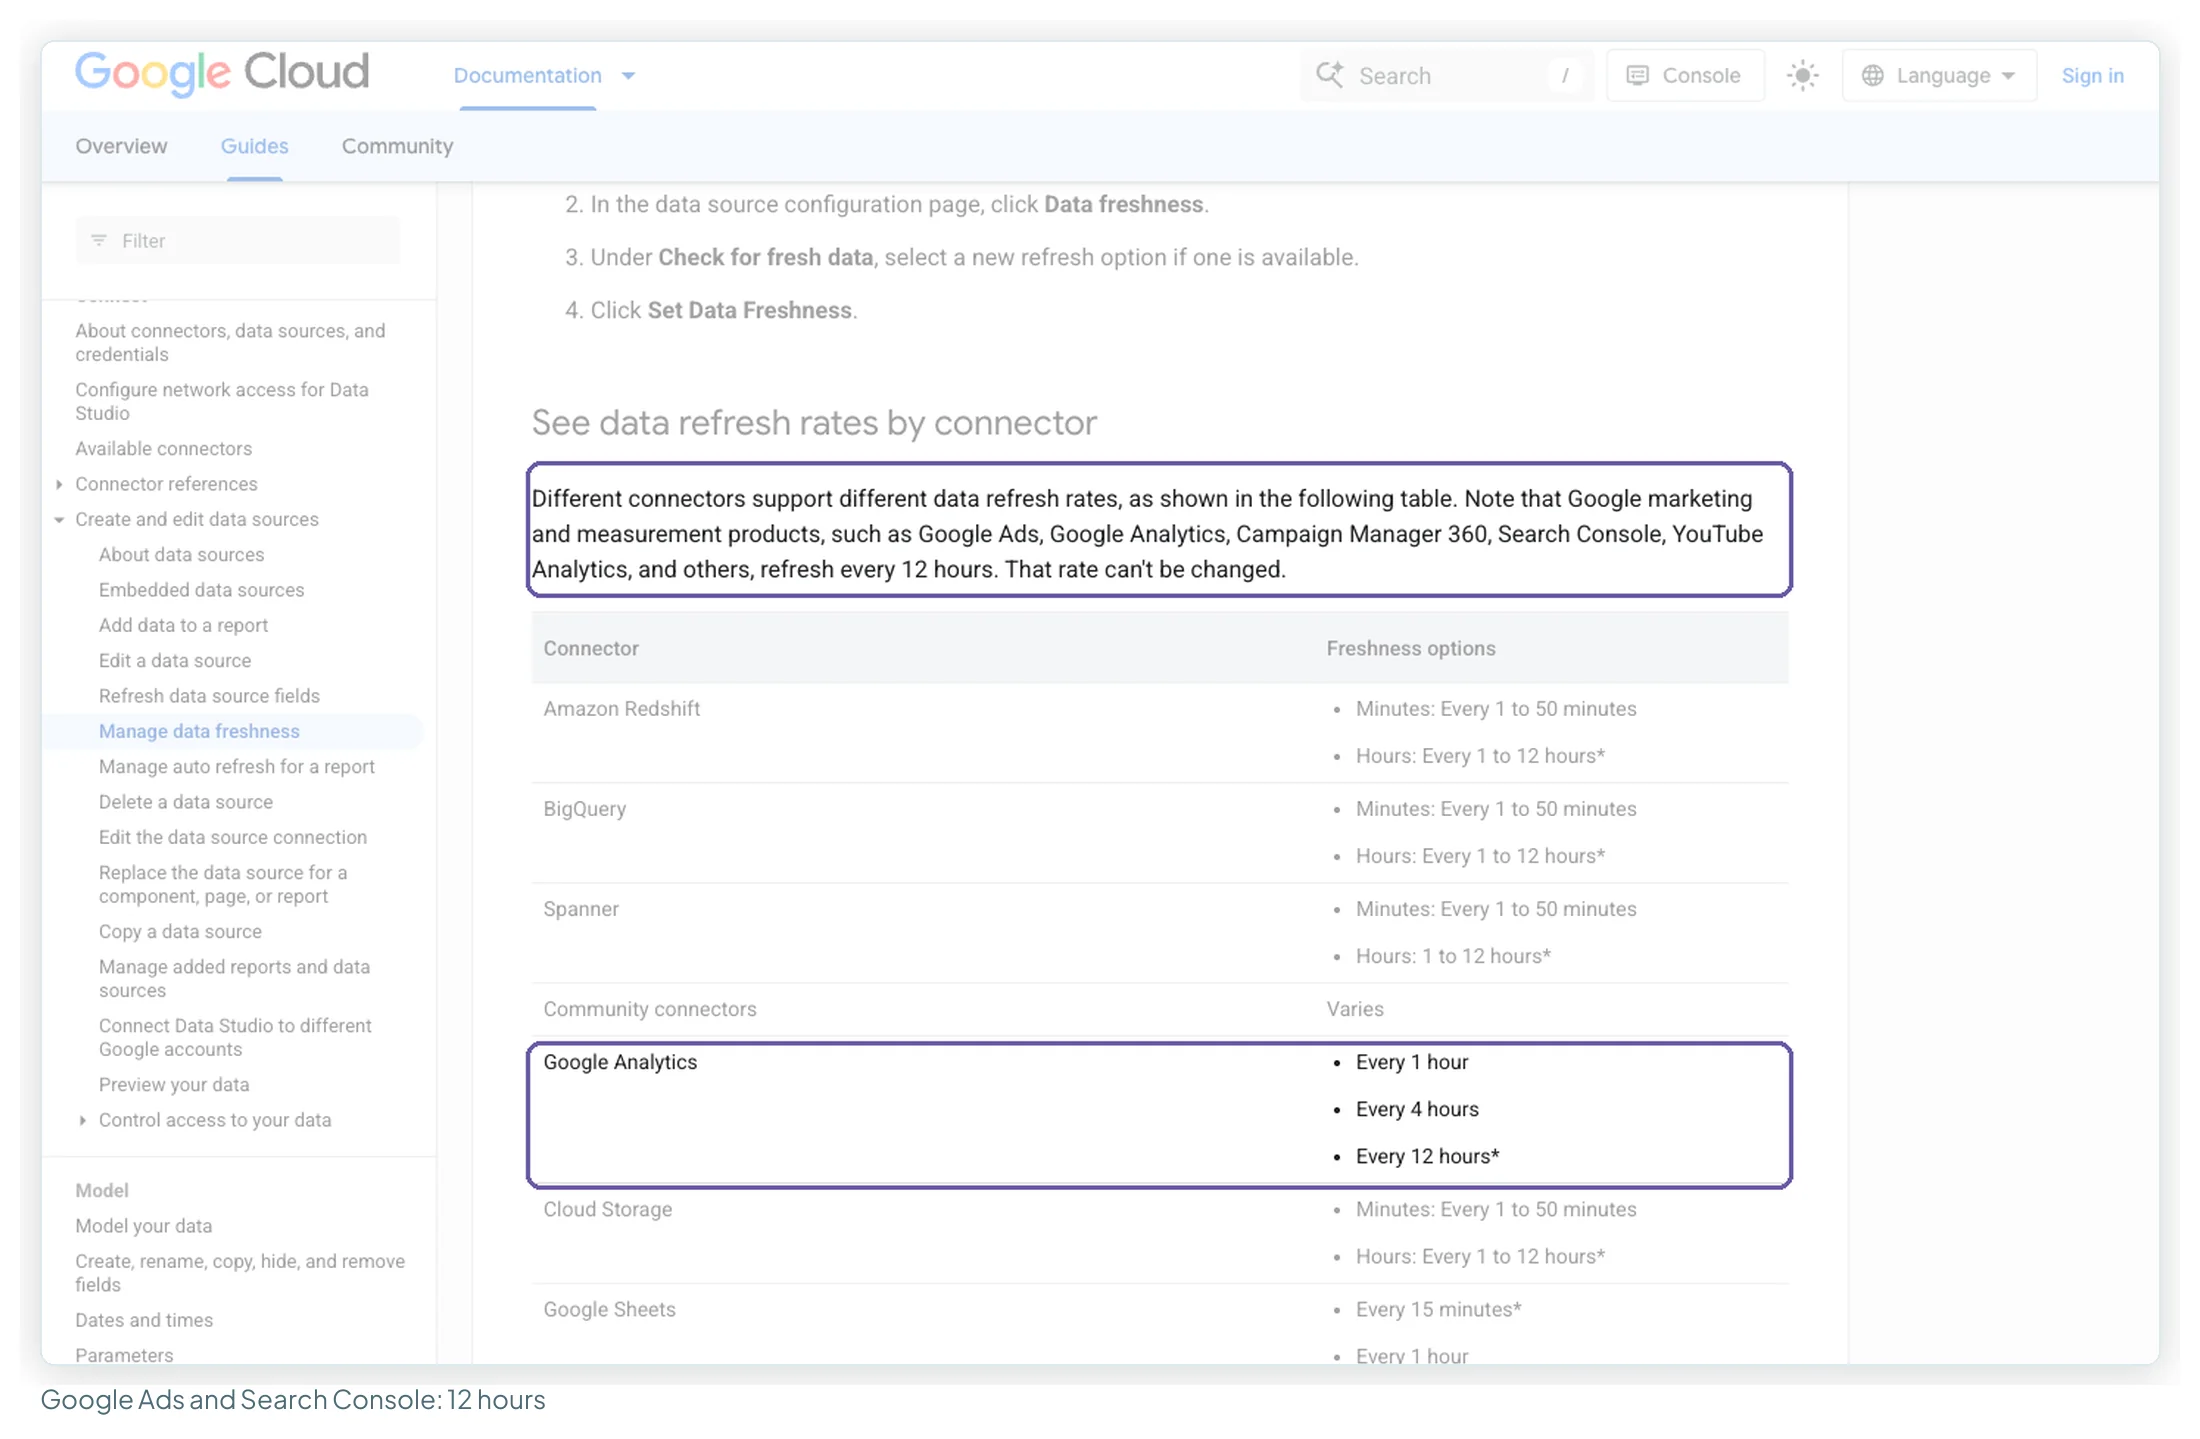
| Refresh | Google Ads and Search Console every 12 hours (fixed); GA4 1, 4 or 12 hours in Google’s table (see below) | 8 a day (Pro) · 48 a day (PPU) | Not stated on the pricing pages |
| Sharing | Link or invite; scheduled email; embed | Licensed users, or anyone on F64/P1 capacity | Licensed users per site; Viewer blocks by quote |
| Embedding | Iframe embed, no extra cost | Power BI Embedded, “Variable” price | Capacity-based pricing, contact sales |
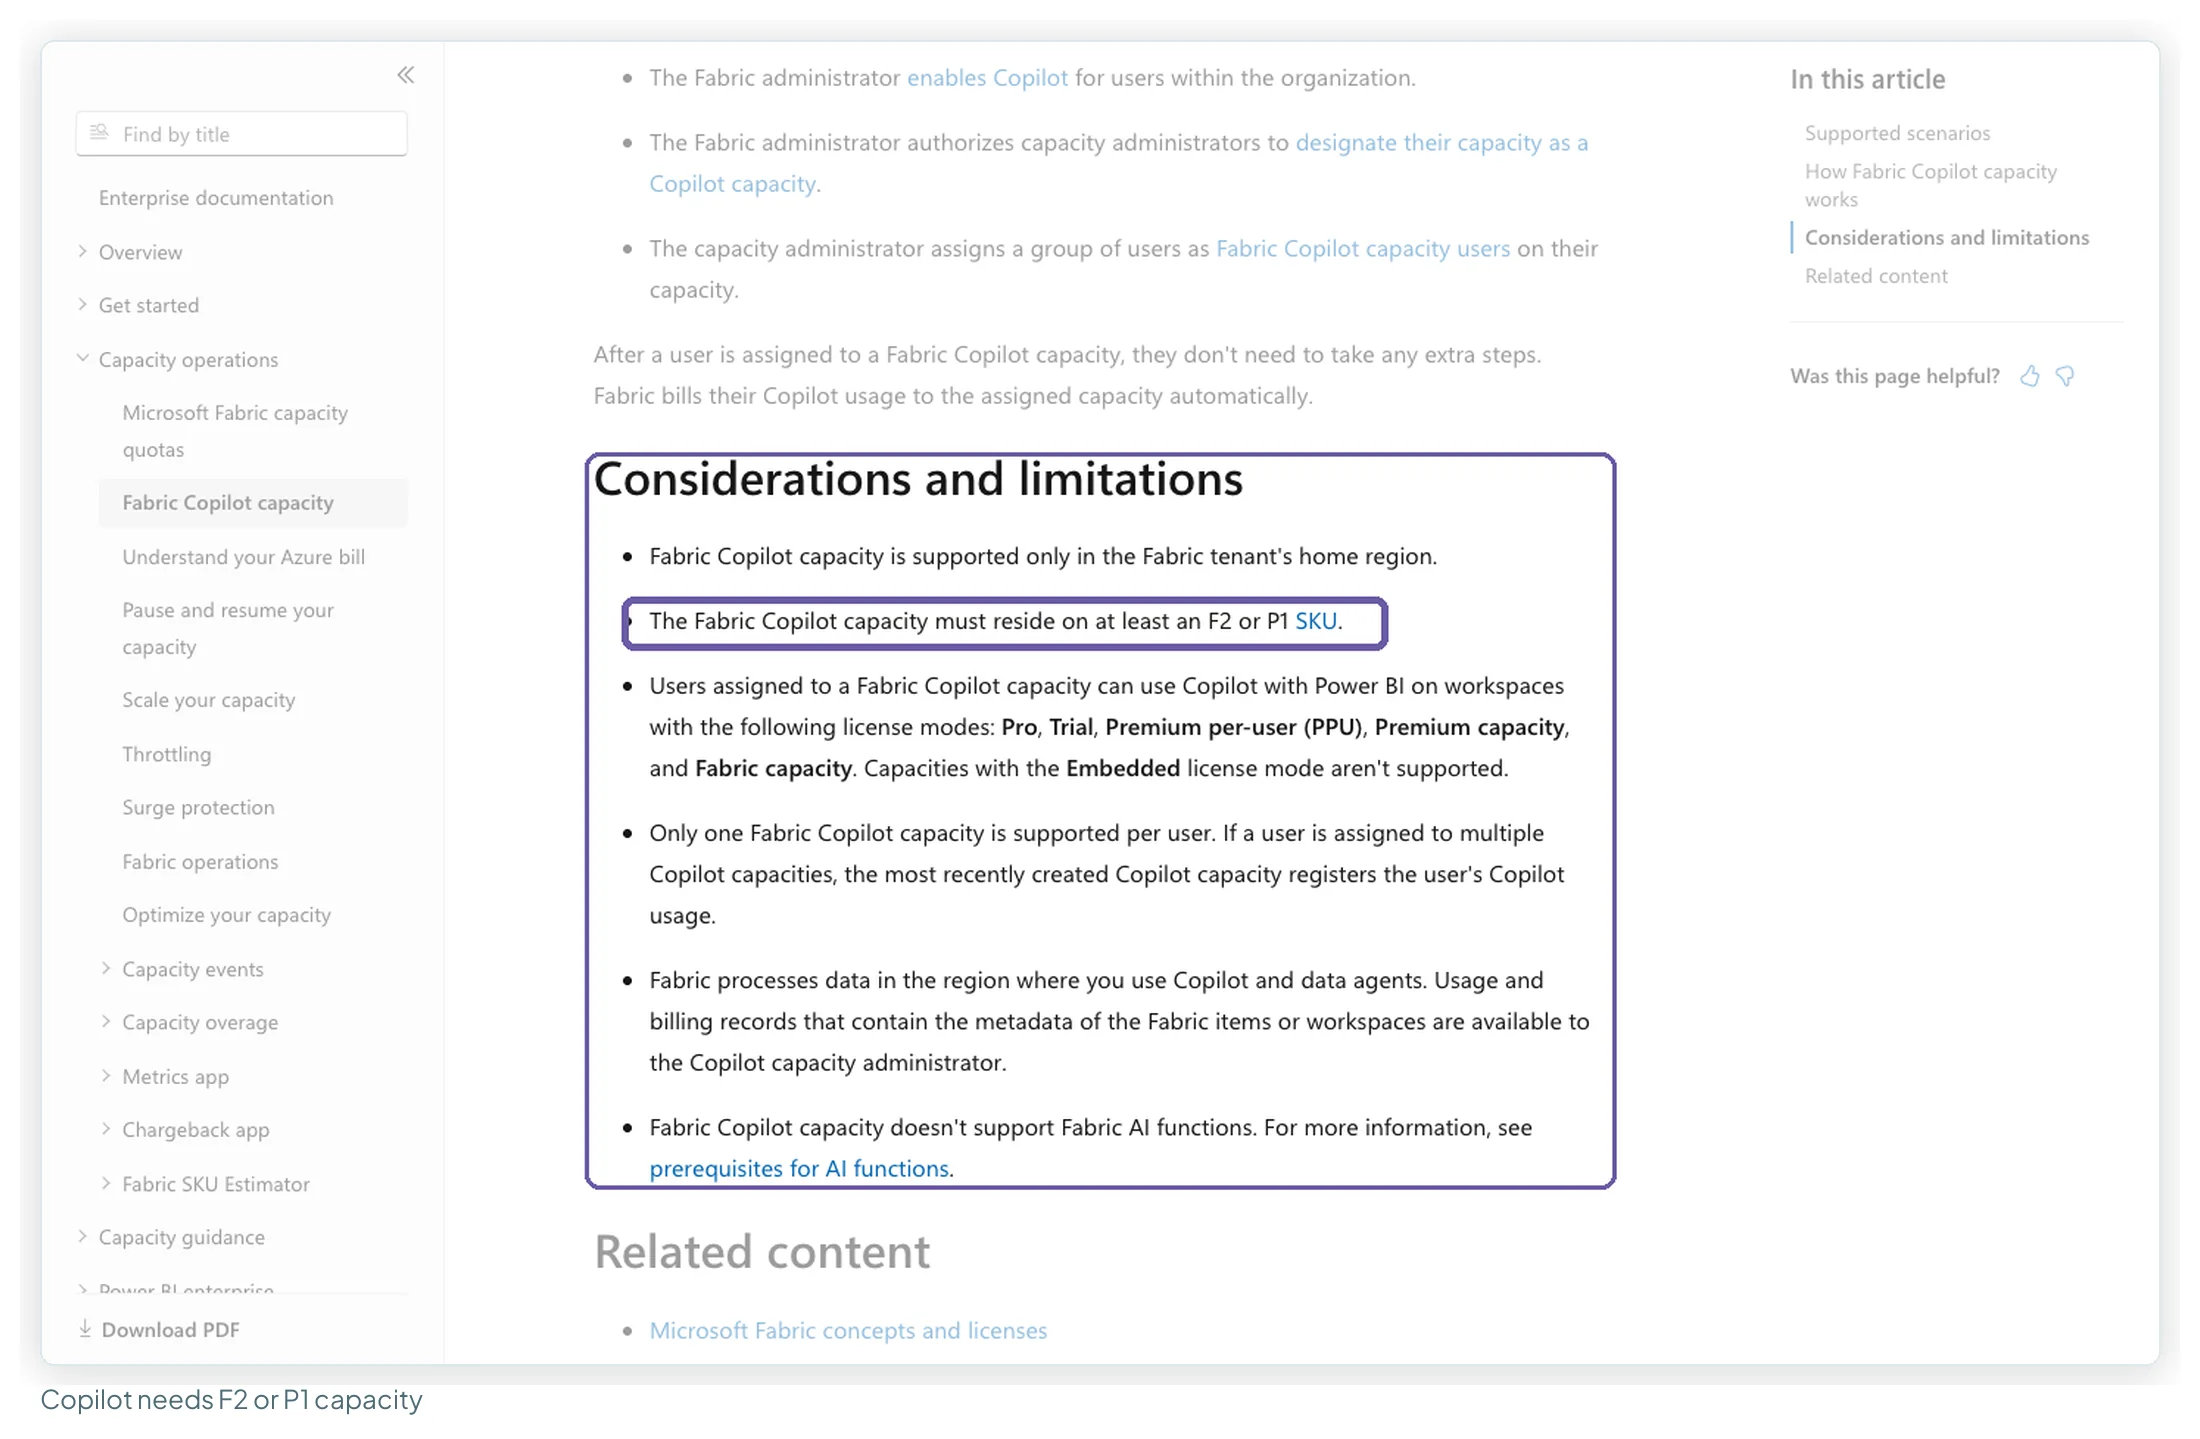
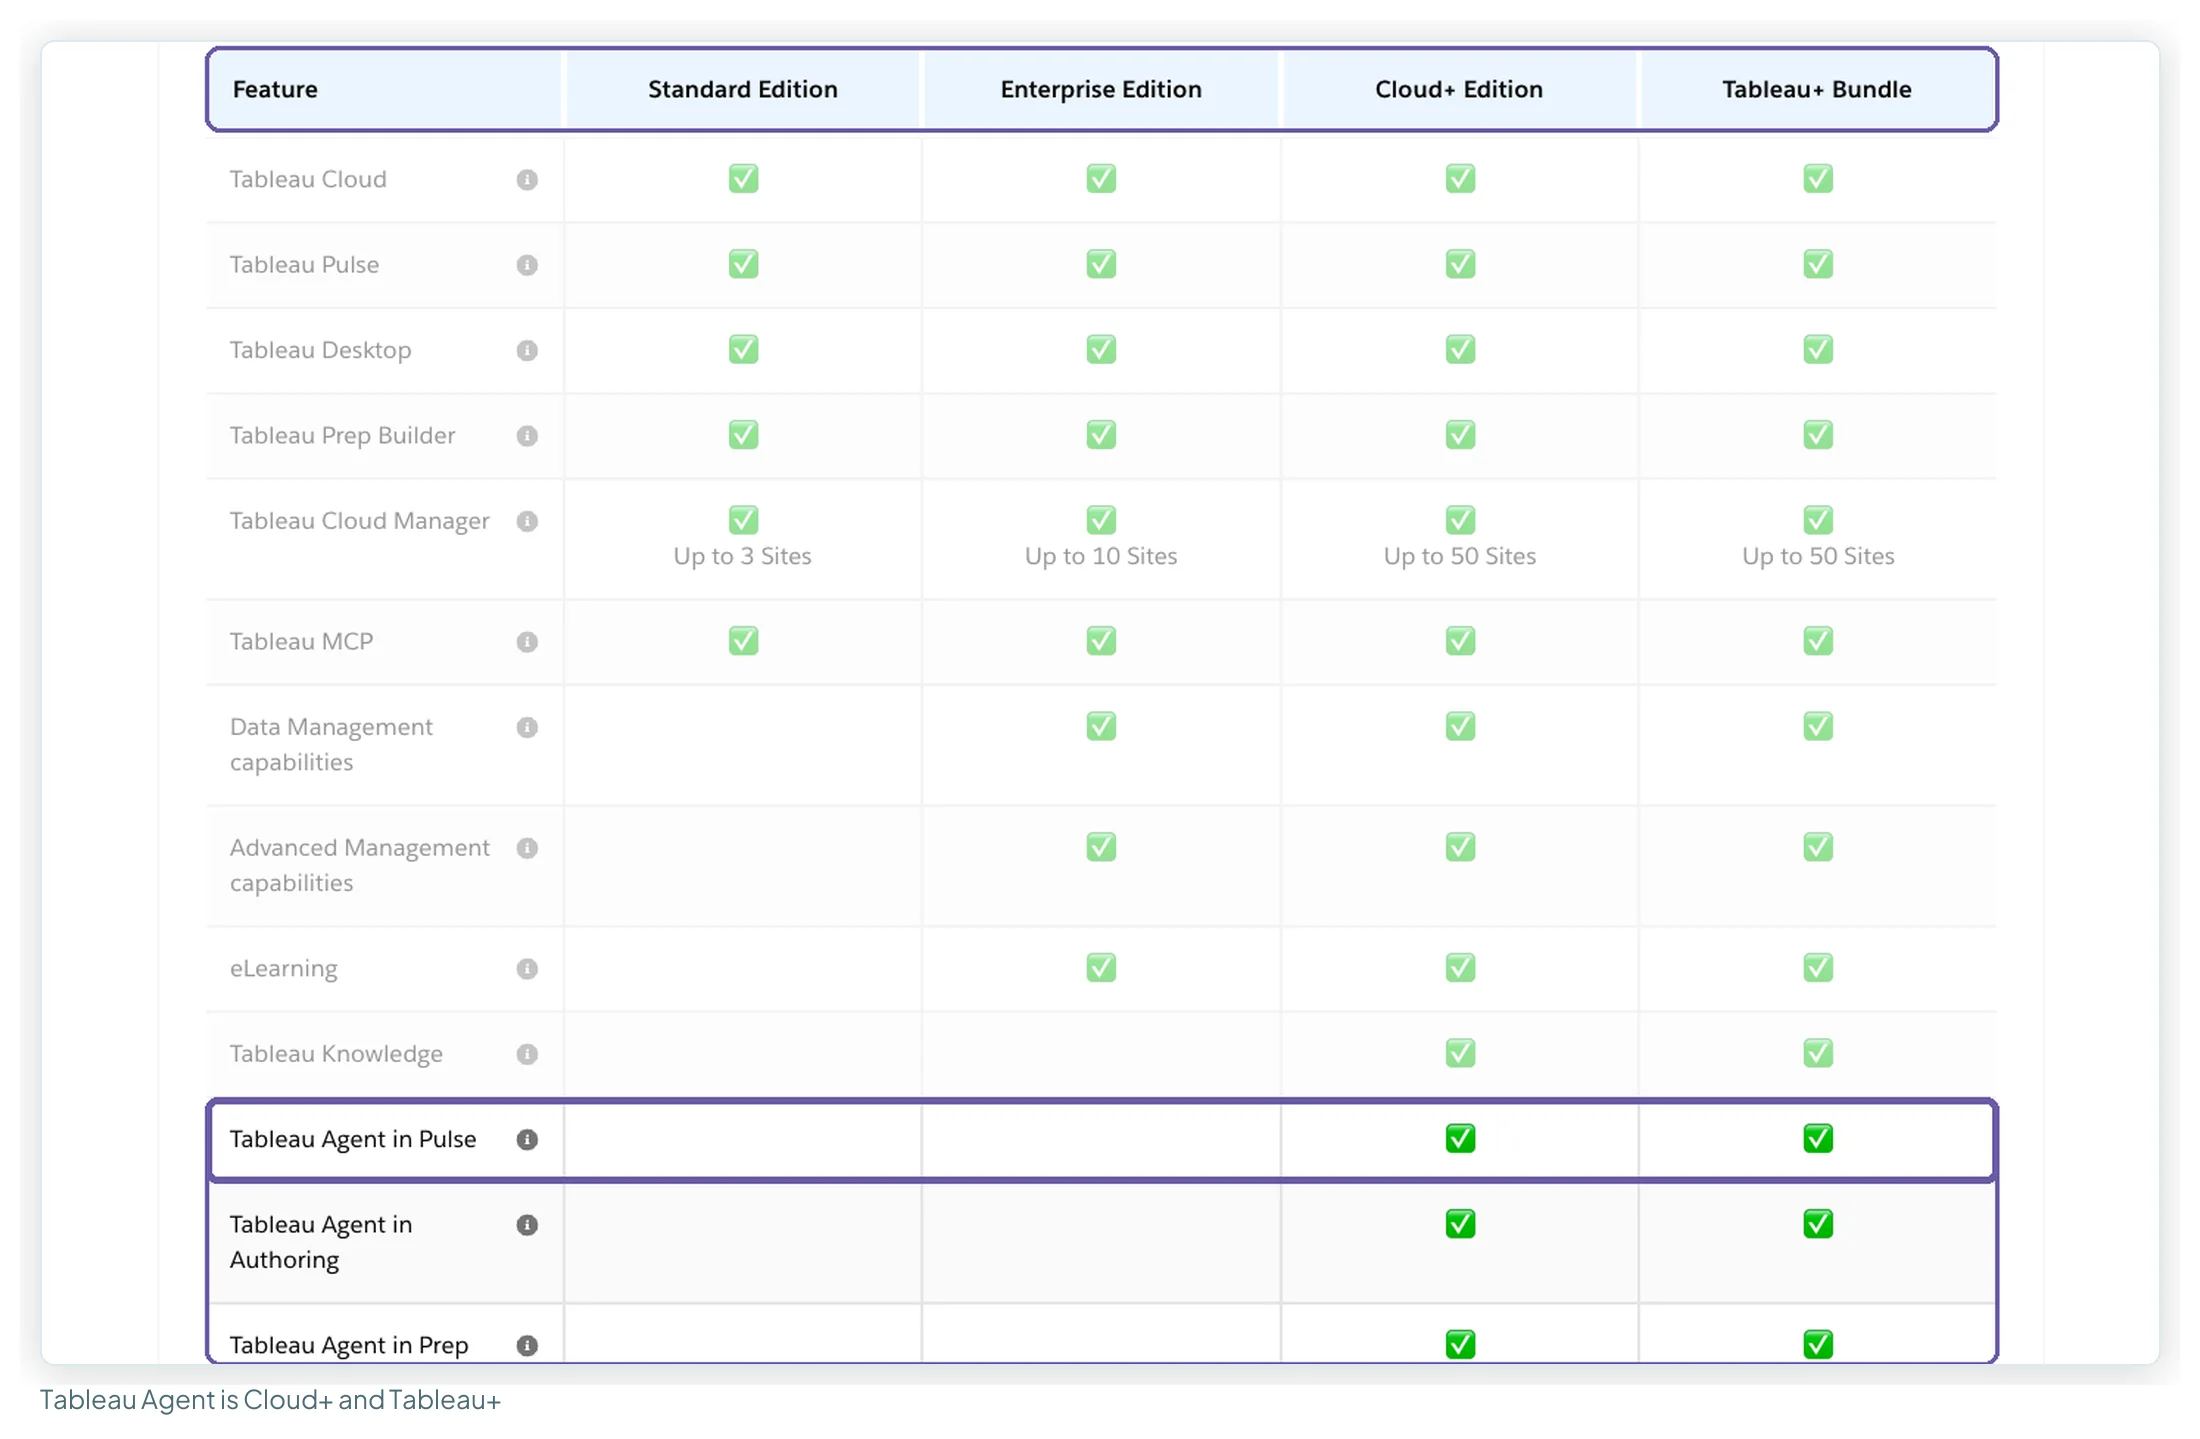
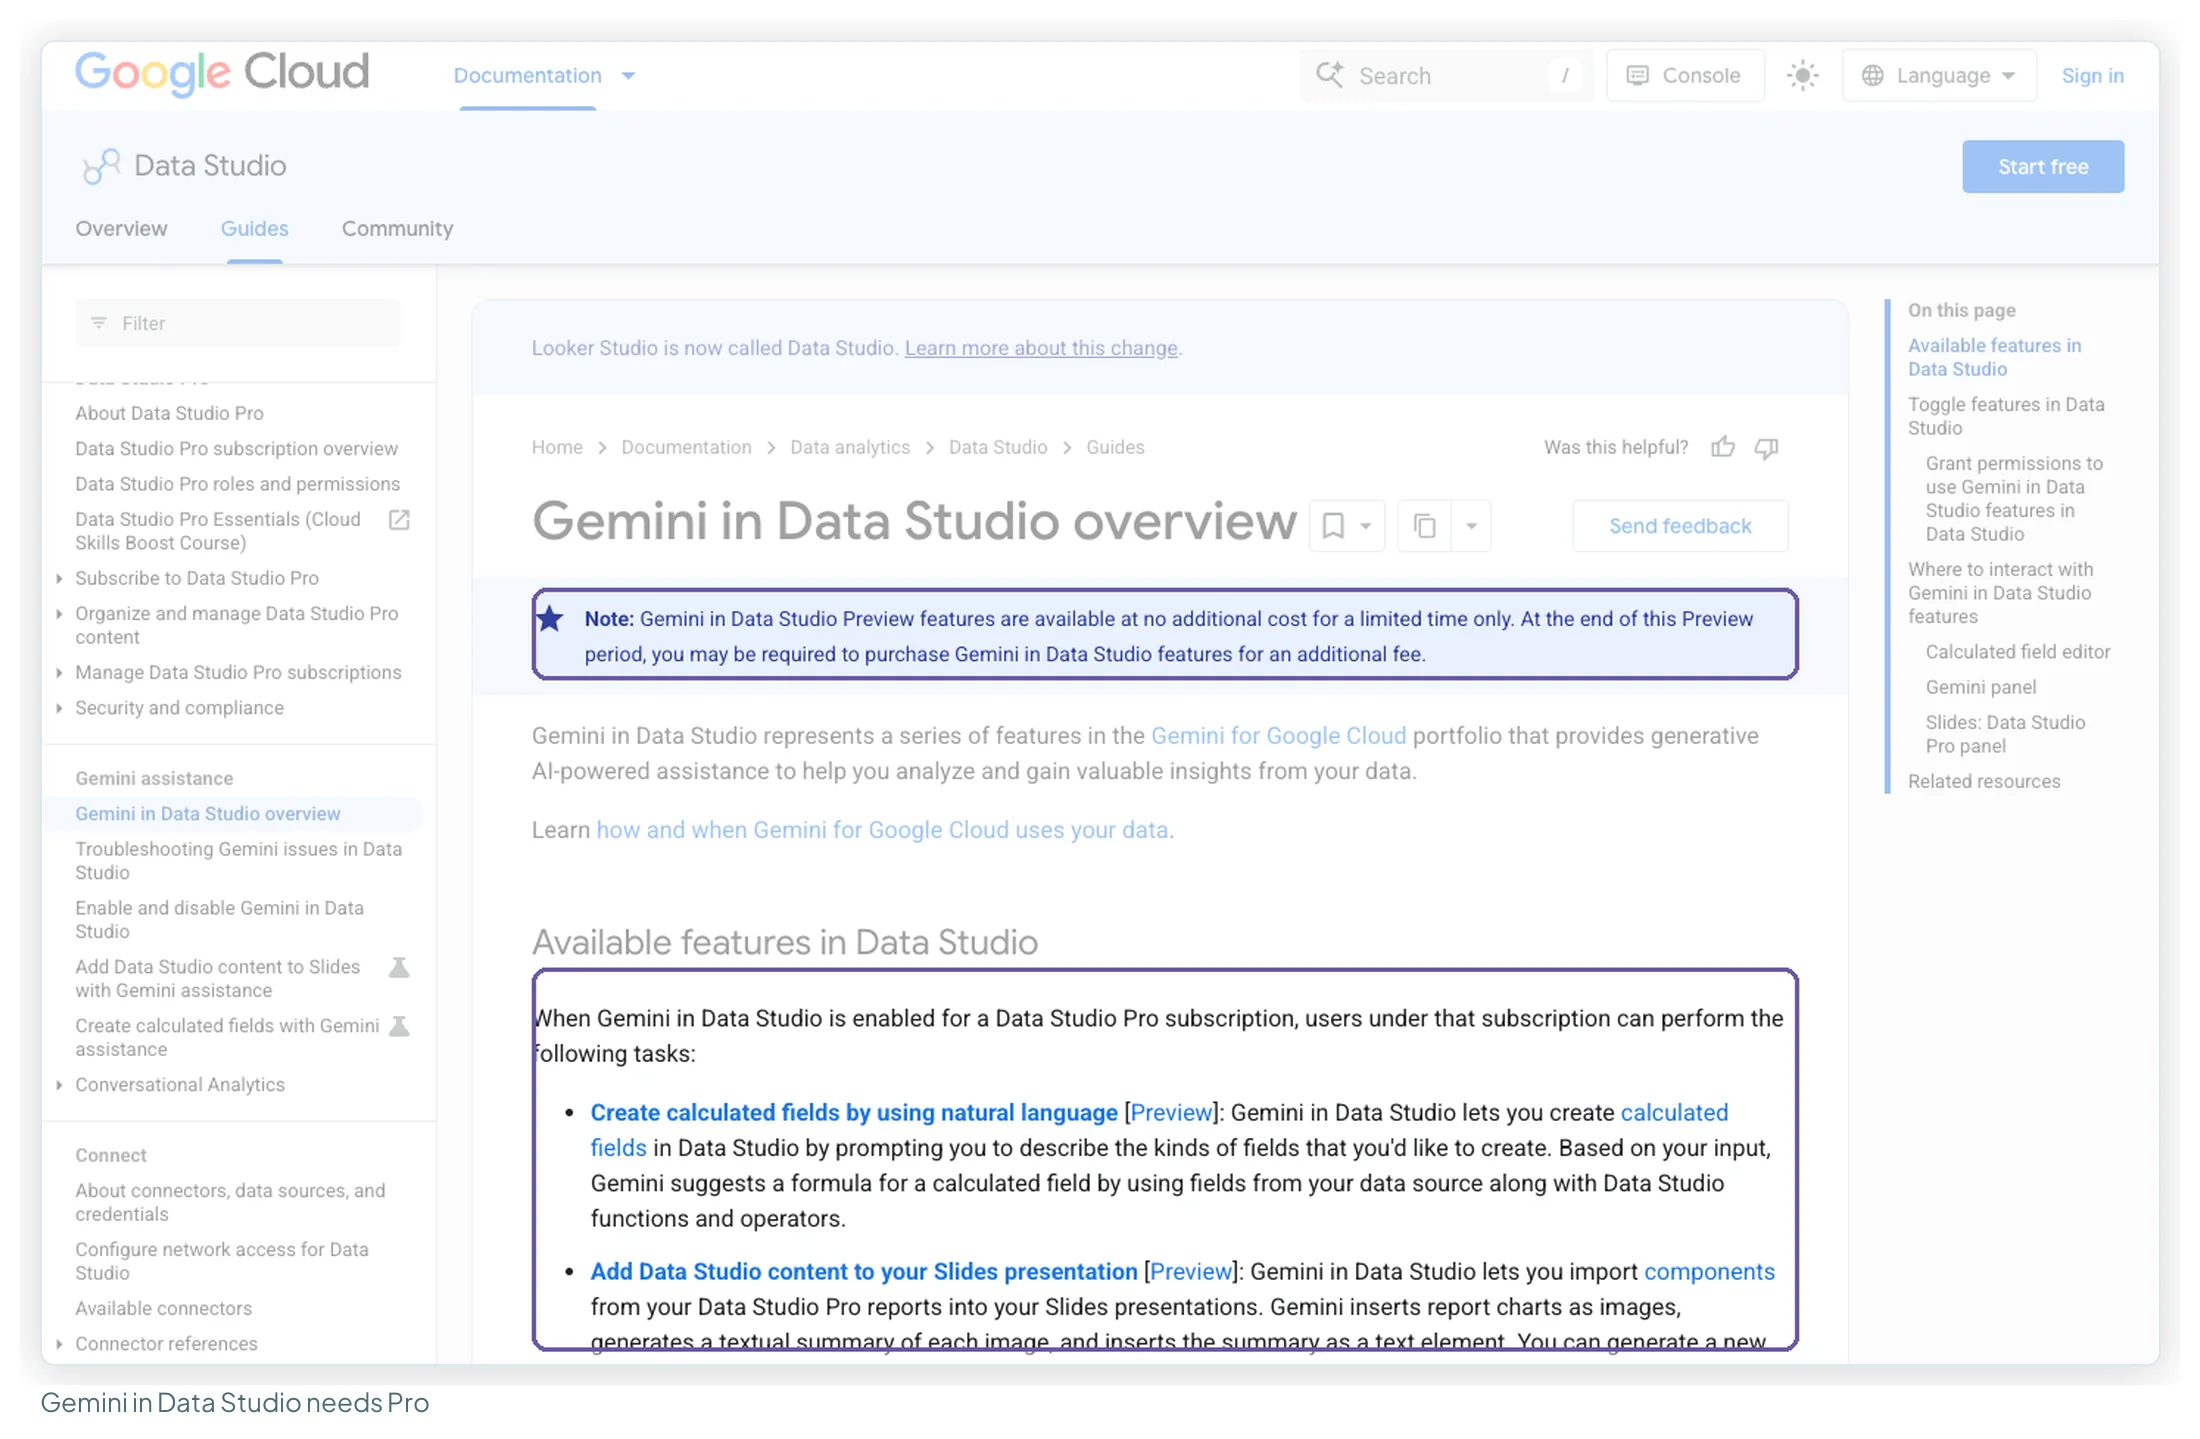
| AI | Gemini (Pro only); Conversational Analytics with BigQuery agents | Copilot, needs F2 or P1 capacity | Pulse and MCP in all editions; Tableau Agent in Cloud+ |
| Mobile | Responsive reports; Looker mobile app with Pro | Power BI Mobile apps | Tableau Mobile for all roles |
| Governance | Pro: organisation-owned content, IAM, team workspaces, CMEK | PPU: XMLA read/write, advanced dataflows | Enterprise: Data Management, Advanced Management |
| Gartner Peer Insights | 4.5 (423 ratings) | 4.4 (4,143) | 4.4 (4,770) |
How this comparison was researched
I haven’t run a hands-on test of Power BI and Tableau for this version, so nothing below claims one. What it’s built on, all read on 13 October 2026:
- Pricing pages: Microsoft’s Power BI pricing page (both the plan cards and the compare-plans table), Tableau’s pricing and Tableau Cloud pricing pages, and Google’s Data Studio product page.
- Connector lists: Microsoft’s Power Query connector index, Tableau’s list of supplied connectors, and Google’s Data Studio connector catalogue.
- Feature documentation: Microsoft Learn (Power BI Desktop requirements, Fabric Copilot capacity), Tableau’s edition comparison, and Google’s docs on freshness, Pro, Gemini and Looker vs Data Studio.
- Reviews: ratings and review counts from G2, Capterra, GetApp, TrustRadius and Gartner Peer Insights, plus a coded sample of 99 written reviews (35 Power BI, 32 Tableau, 32 Data Studio).
- Forums: 24 Reddit threads across r/PowerBI, r/tableau, r/GoogleDataStudio, r/AskMarketing, r/PPC and others. Reddit blocked every way of reading them in full, so I’ve used them only for what their titles and snippets show.
- The ranking articles: 14 readable comparison pages for “looker studio vs power bi” and the three-way query (the top 10, the pages AI Overviews cite and two recent rankers), each data point checked against the vendors’ pages.
That check matters. Five of those 14 pages still give Power BI Pro’s price as $10 (or €10) a month, which it hasn’t been since 1 April 2025, and none mentions the rename back to Data Studio.
What each one costs to build
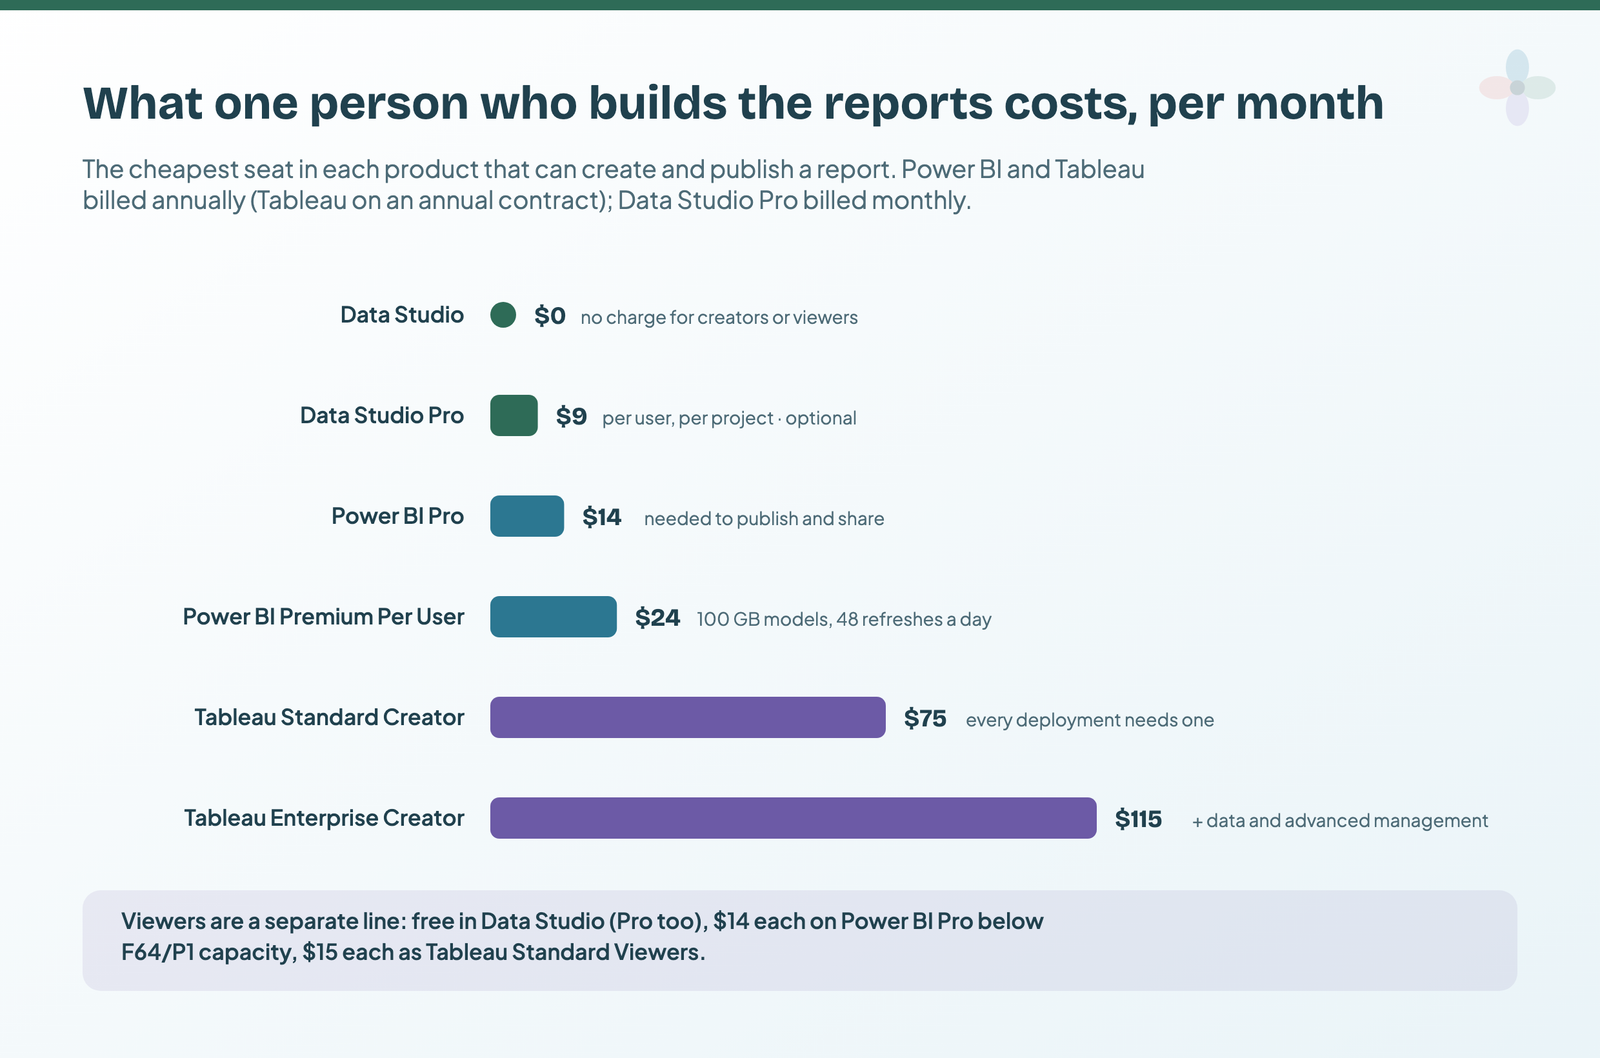
The person who builds the reports is the first cost. Here’s the cheapest seat in each product that can create and publish a report:
Data Studio: free, with an optional Pro tier
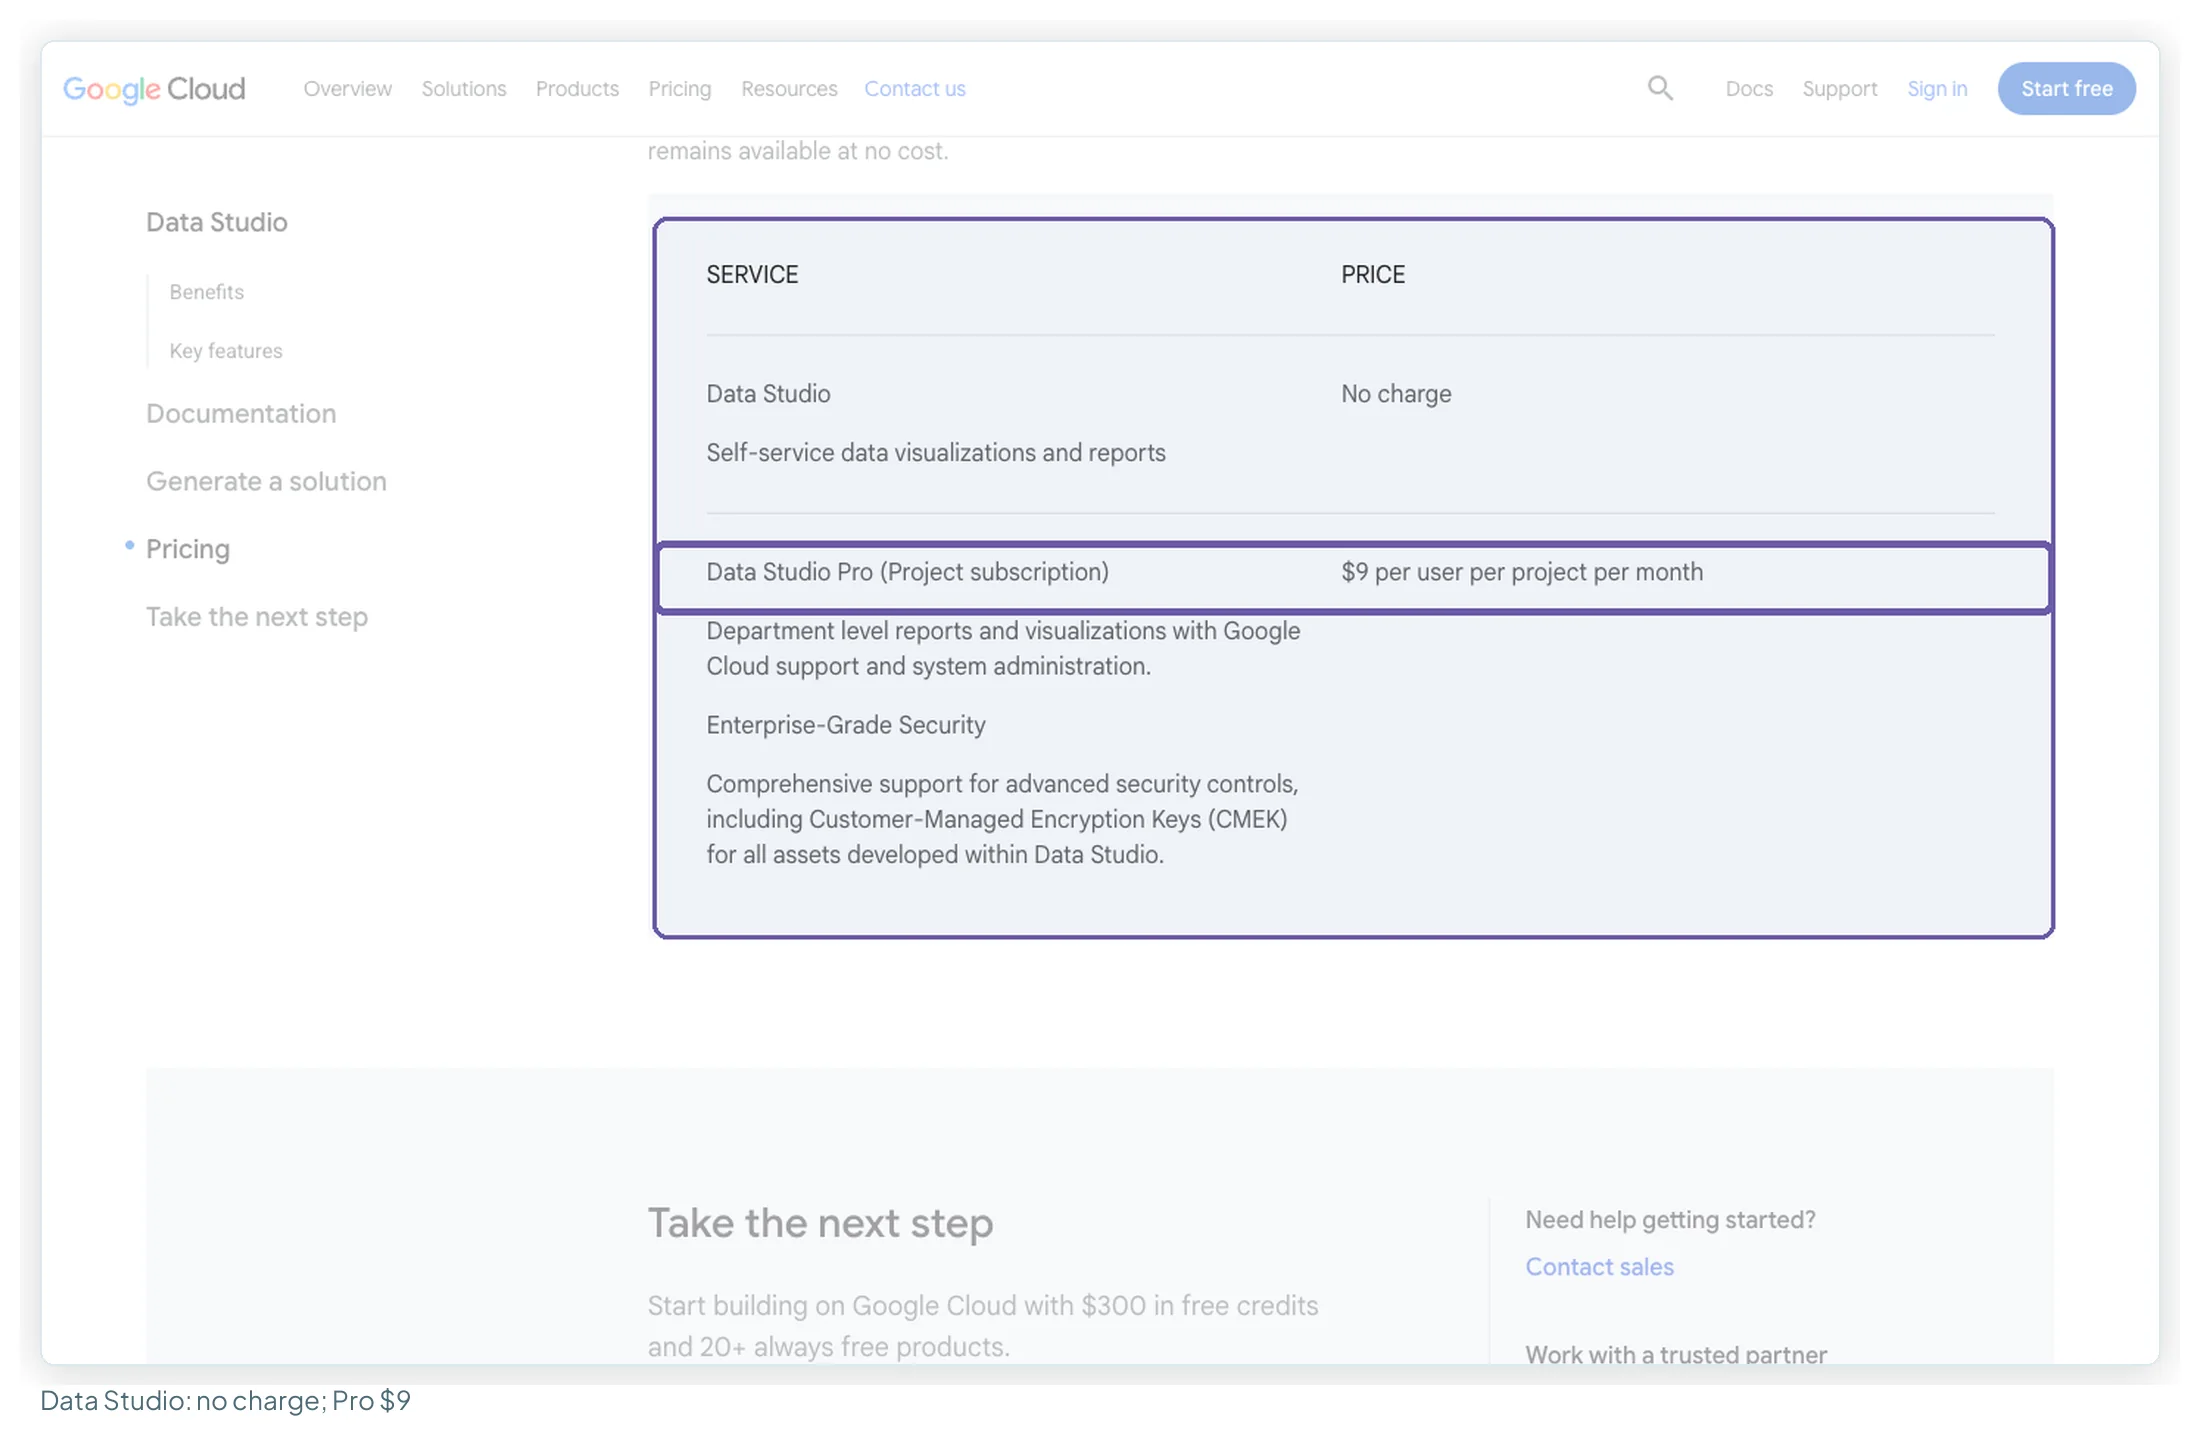
Google’s product page lists Data Studio at “No charge” and Data Studio Pro at $9 per user per project per month. Pro is billed monthly for every licence assigned, whether or not it’s used (Google notes the per-user price varies with the length of the subscription), and comes with a 30-day trial that turns into billing automatically. It adds organisation-owned content (reports that survive a leaver), team workspaces, up to 200 delivery schedules per report, chart alerts, Google Chat delivery and Gemini. I’ve covered whether you need Pro separately.
Power BI: free to build, Pro to publish
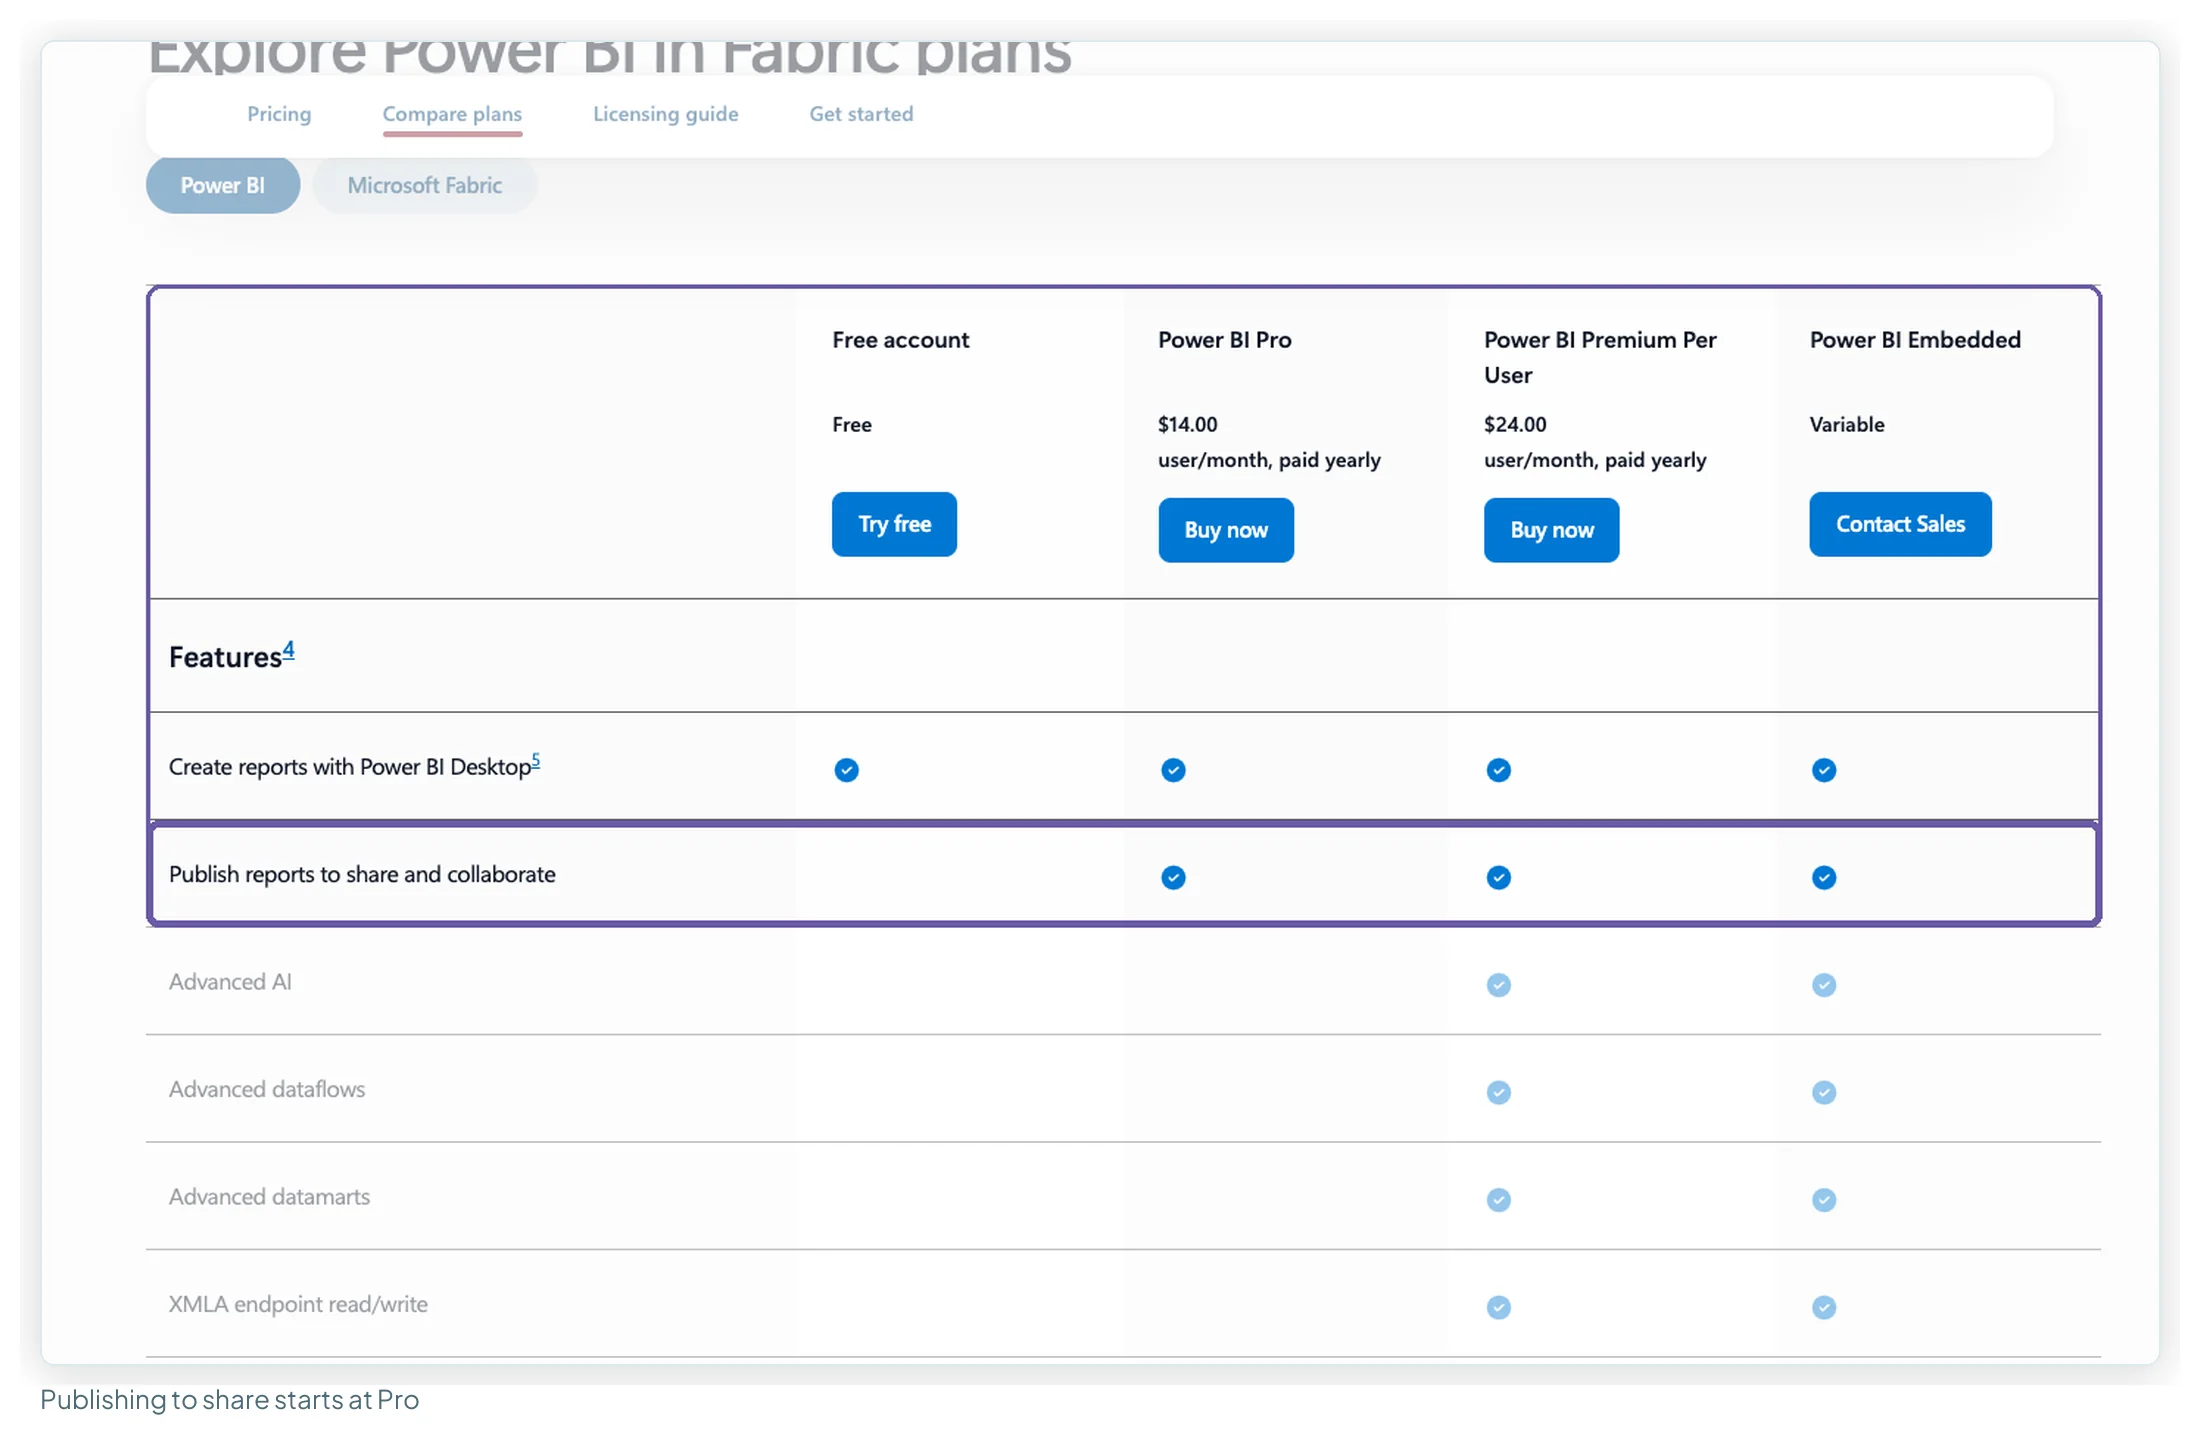
Power BI Desktop is a free download, and the free account lets you “create rich, interactive reports”. Publishing and sharing starts at Pro, $14 per user per month paid yearly. Premium Per User is $24 and adds 100 GB models, 48 refreshes a day and enterprise features. Both rose on 1 April 2025, from $10 and $20, Microsoft’s first price change since launch. That’s why so many articles still print the old figures, and Google’s AI Overviews for both queries still include the $10 one.
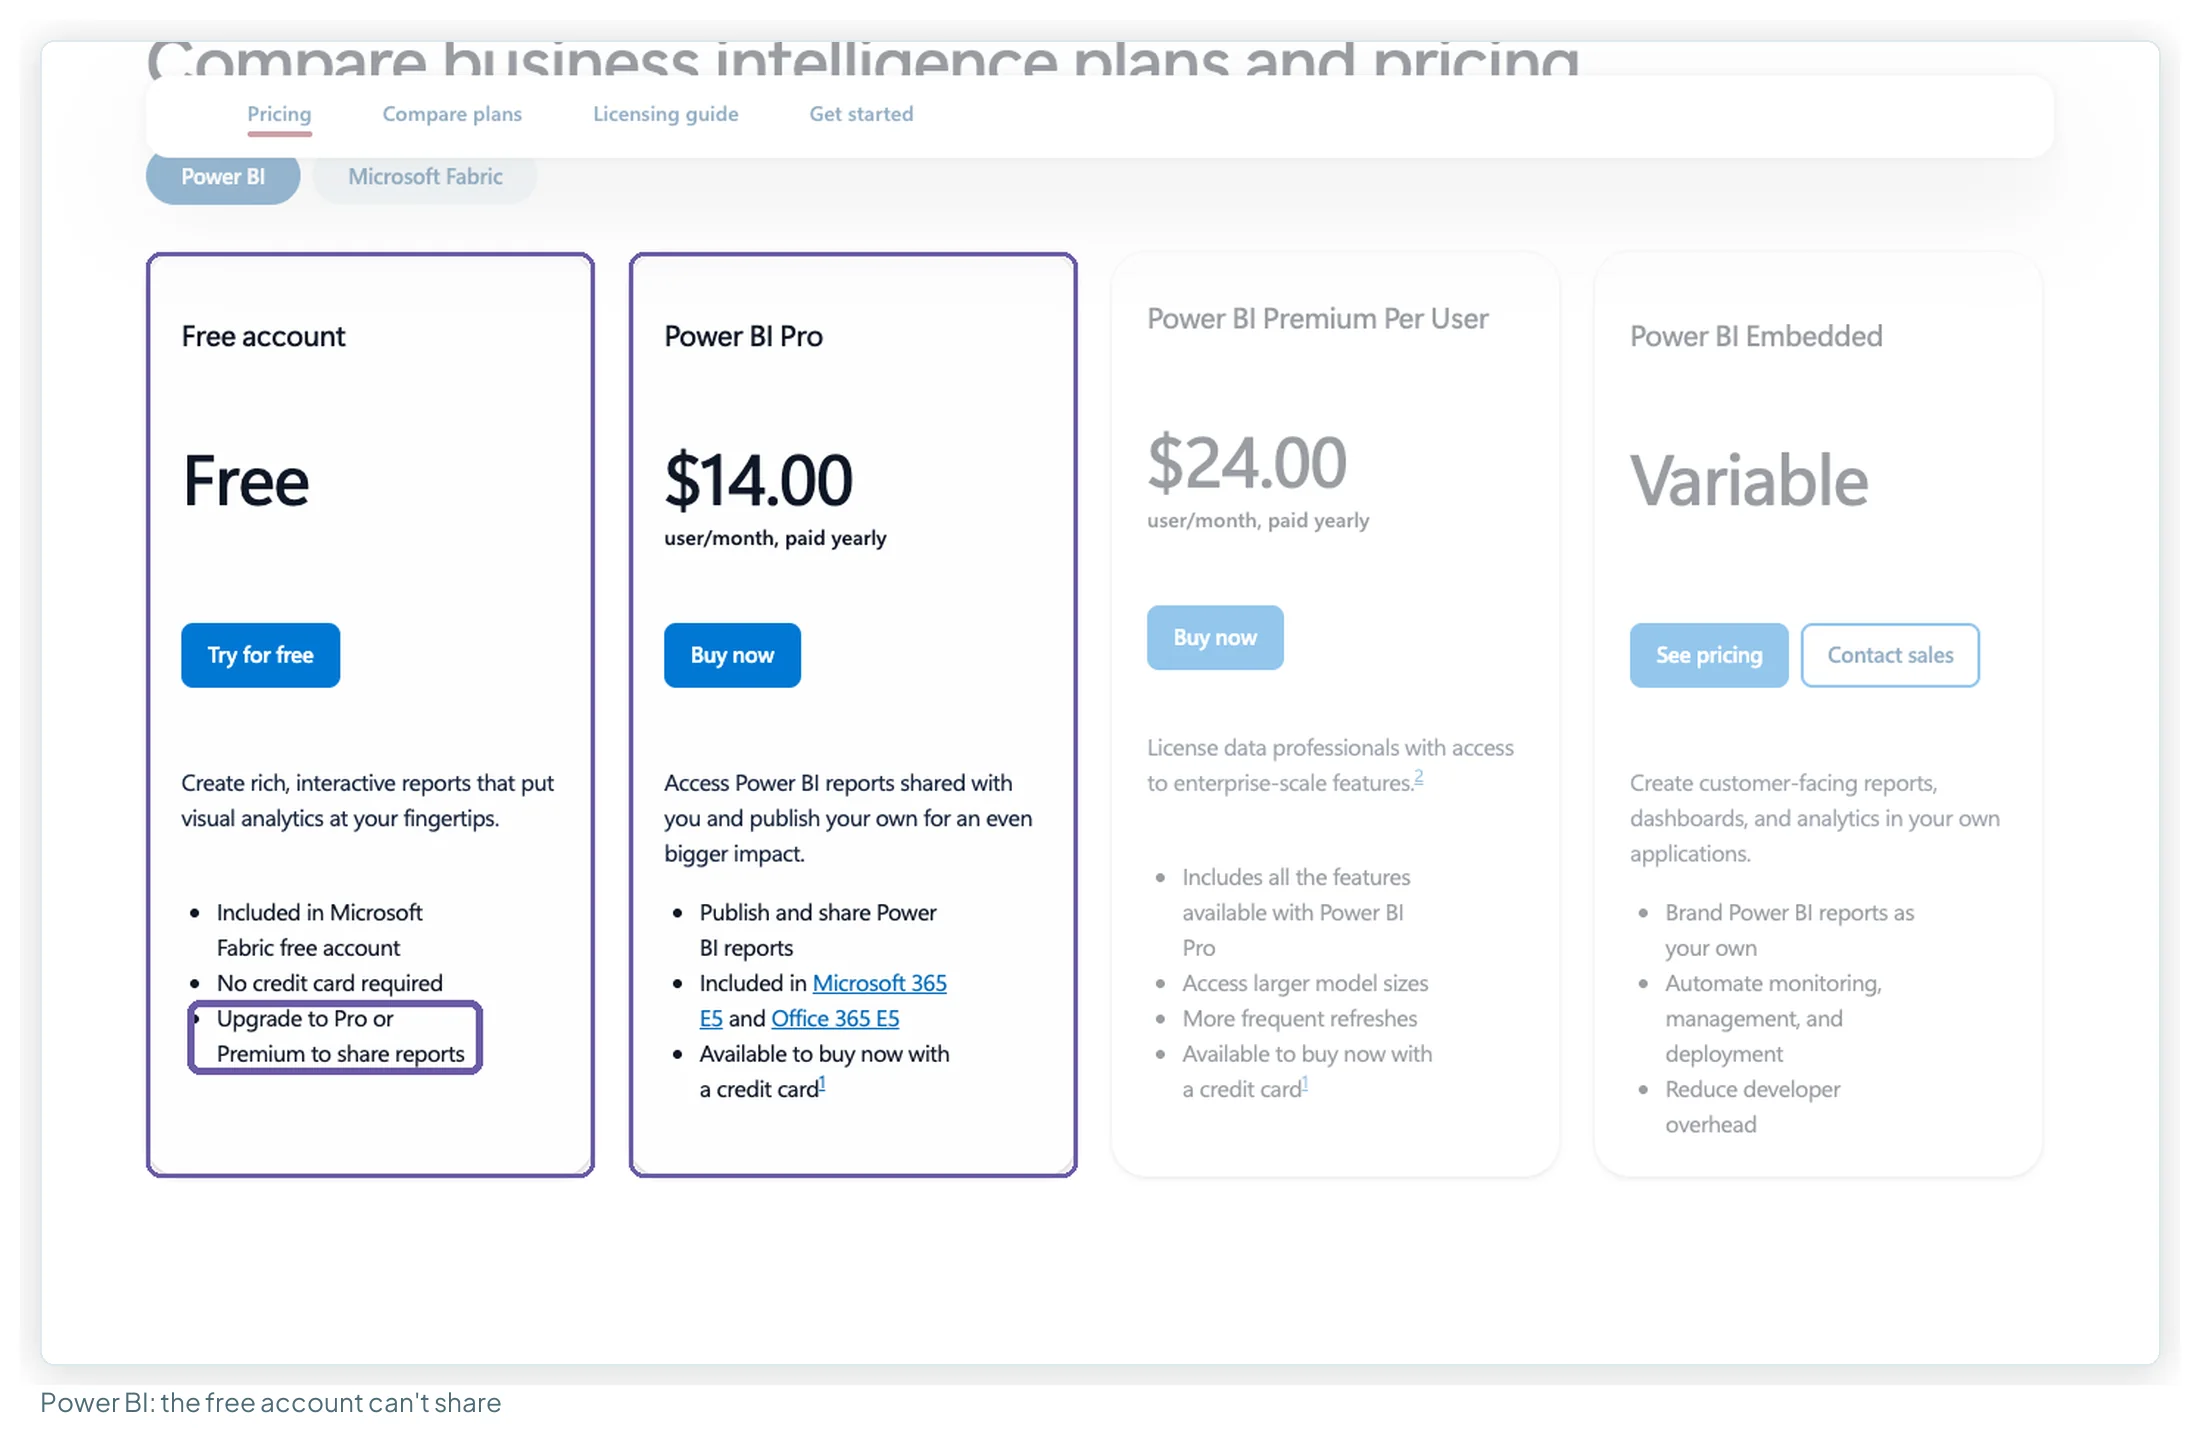
Tableau: a Creator, then a role for everyone else
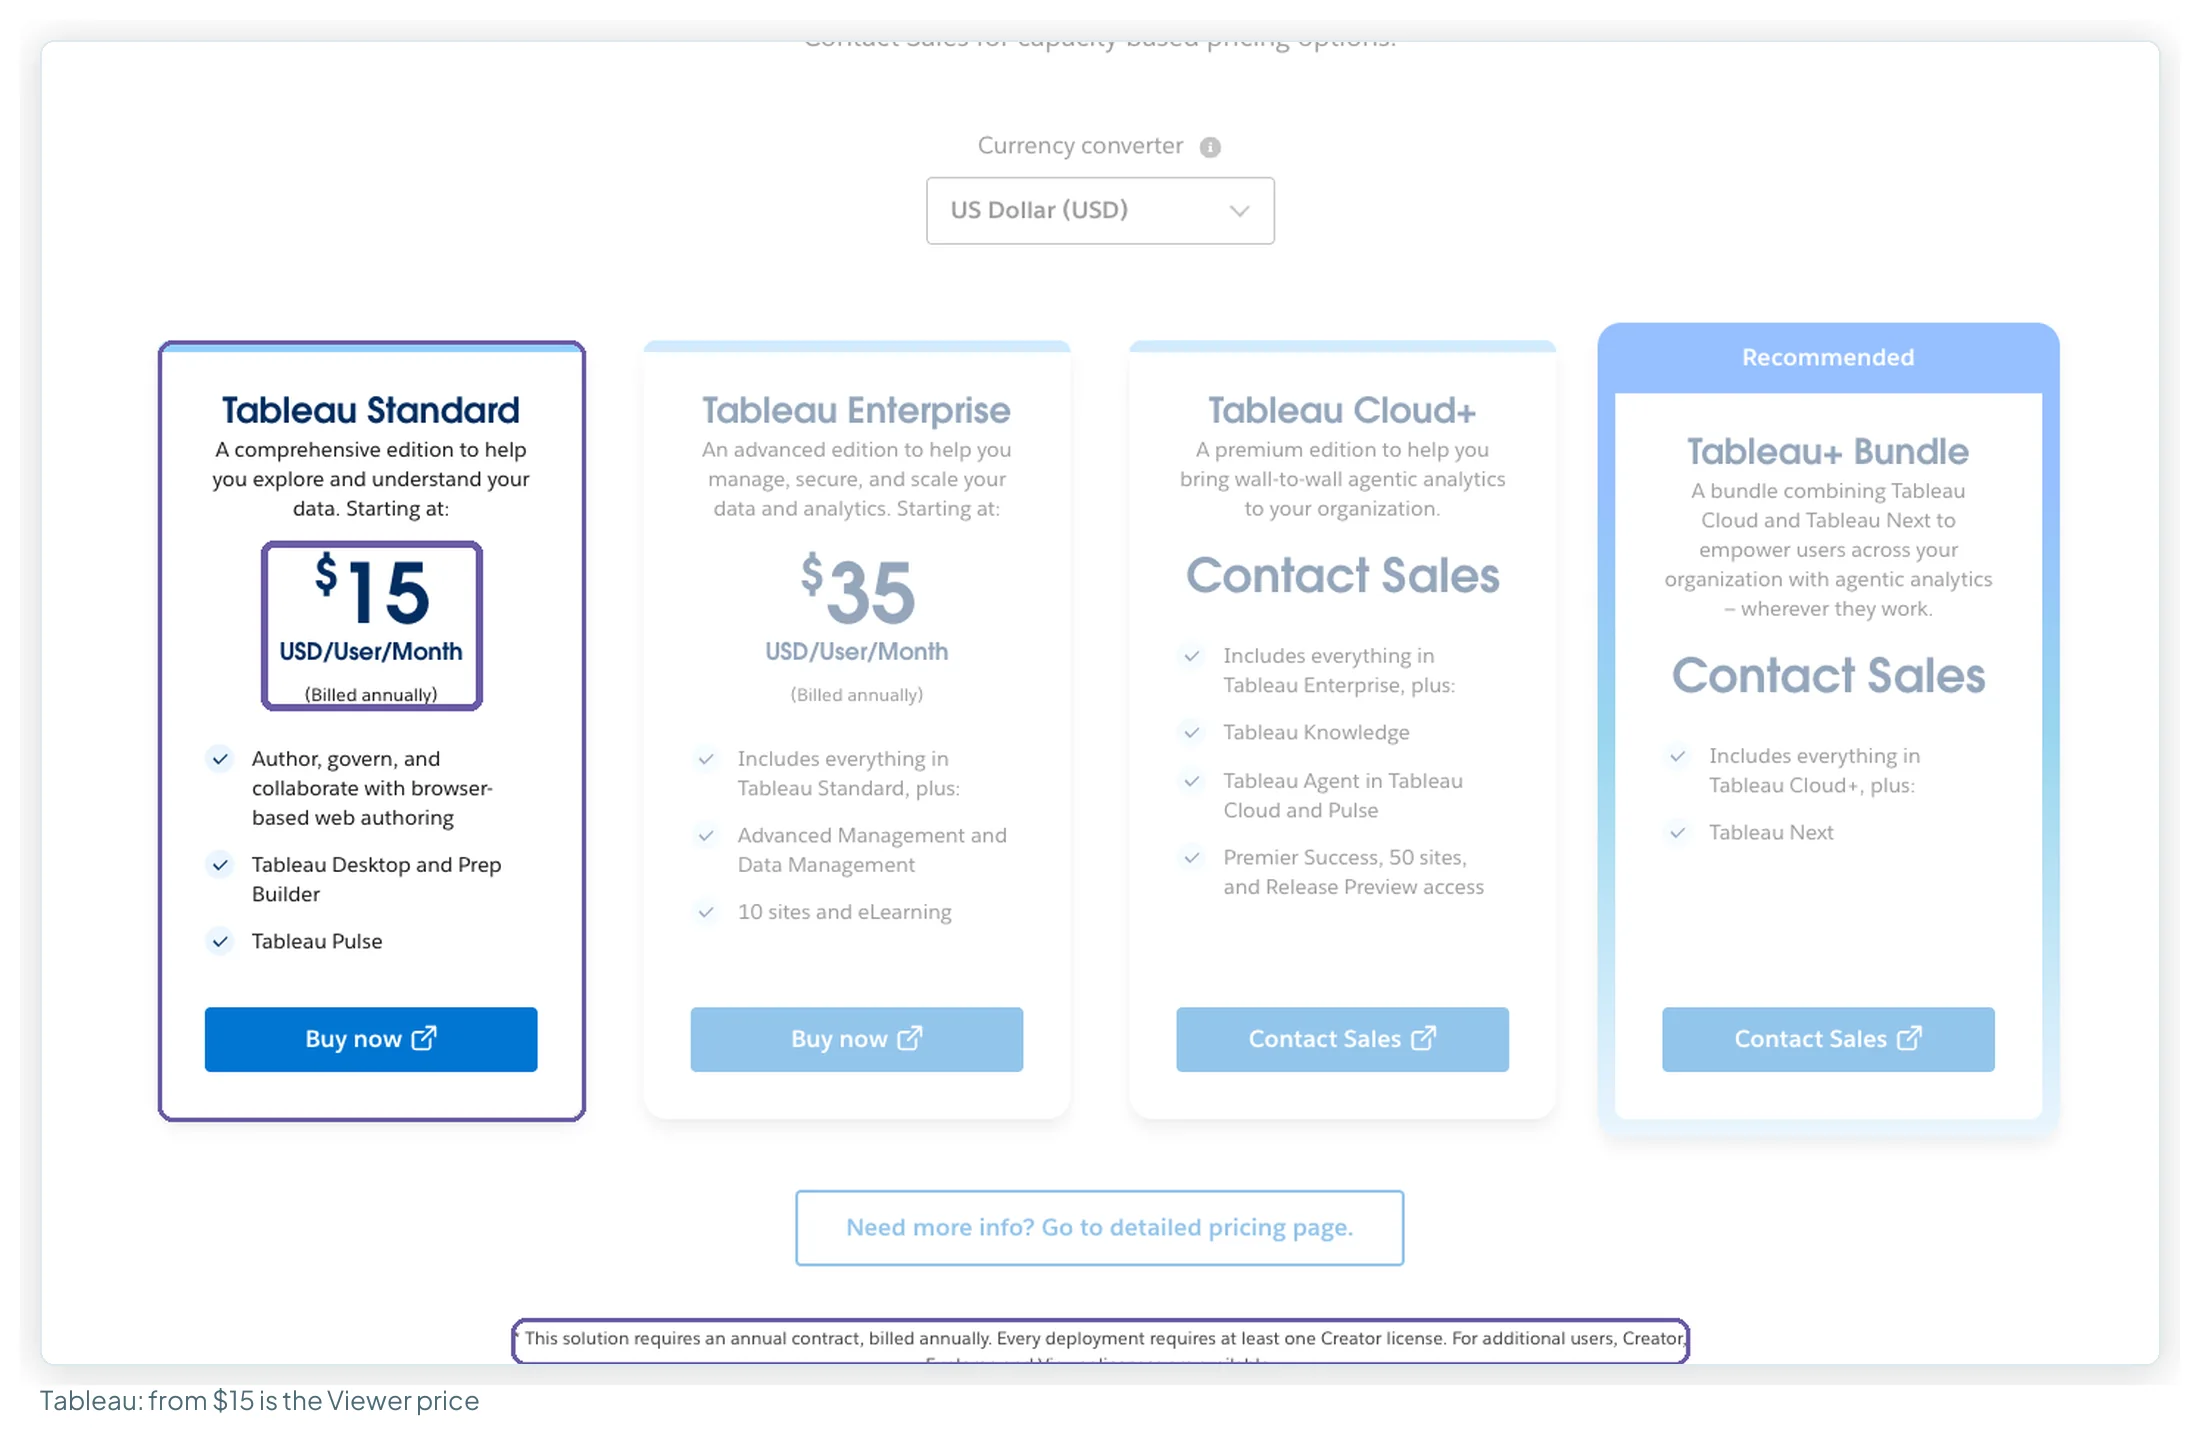
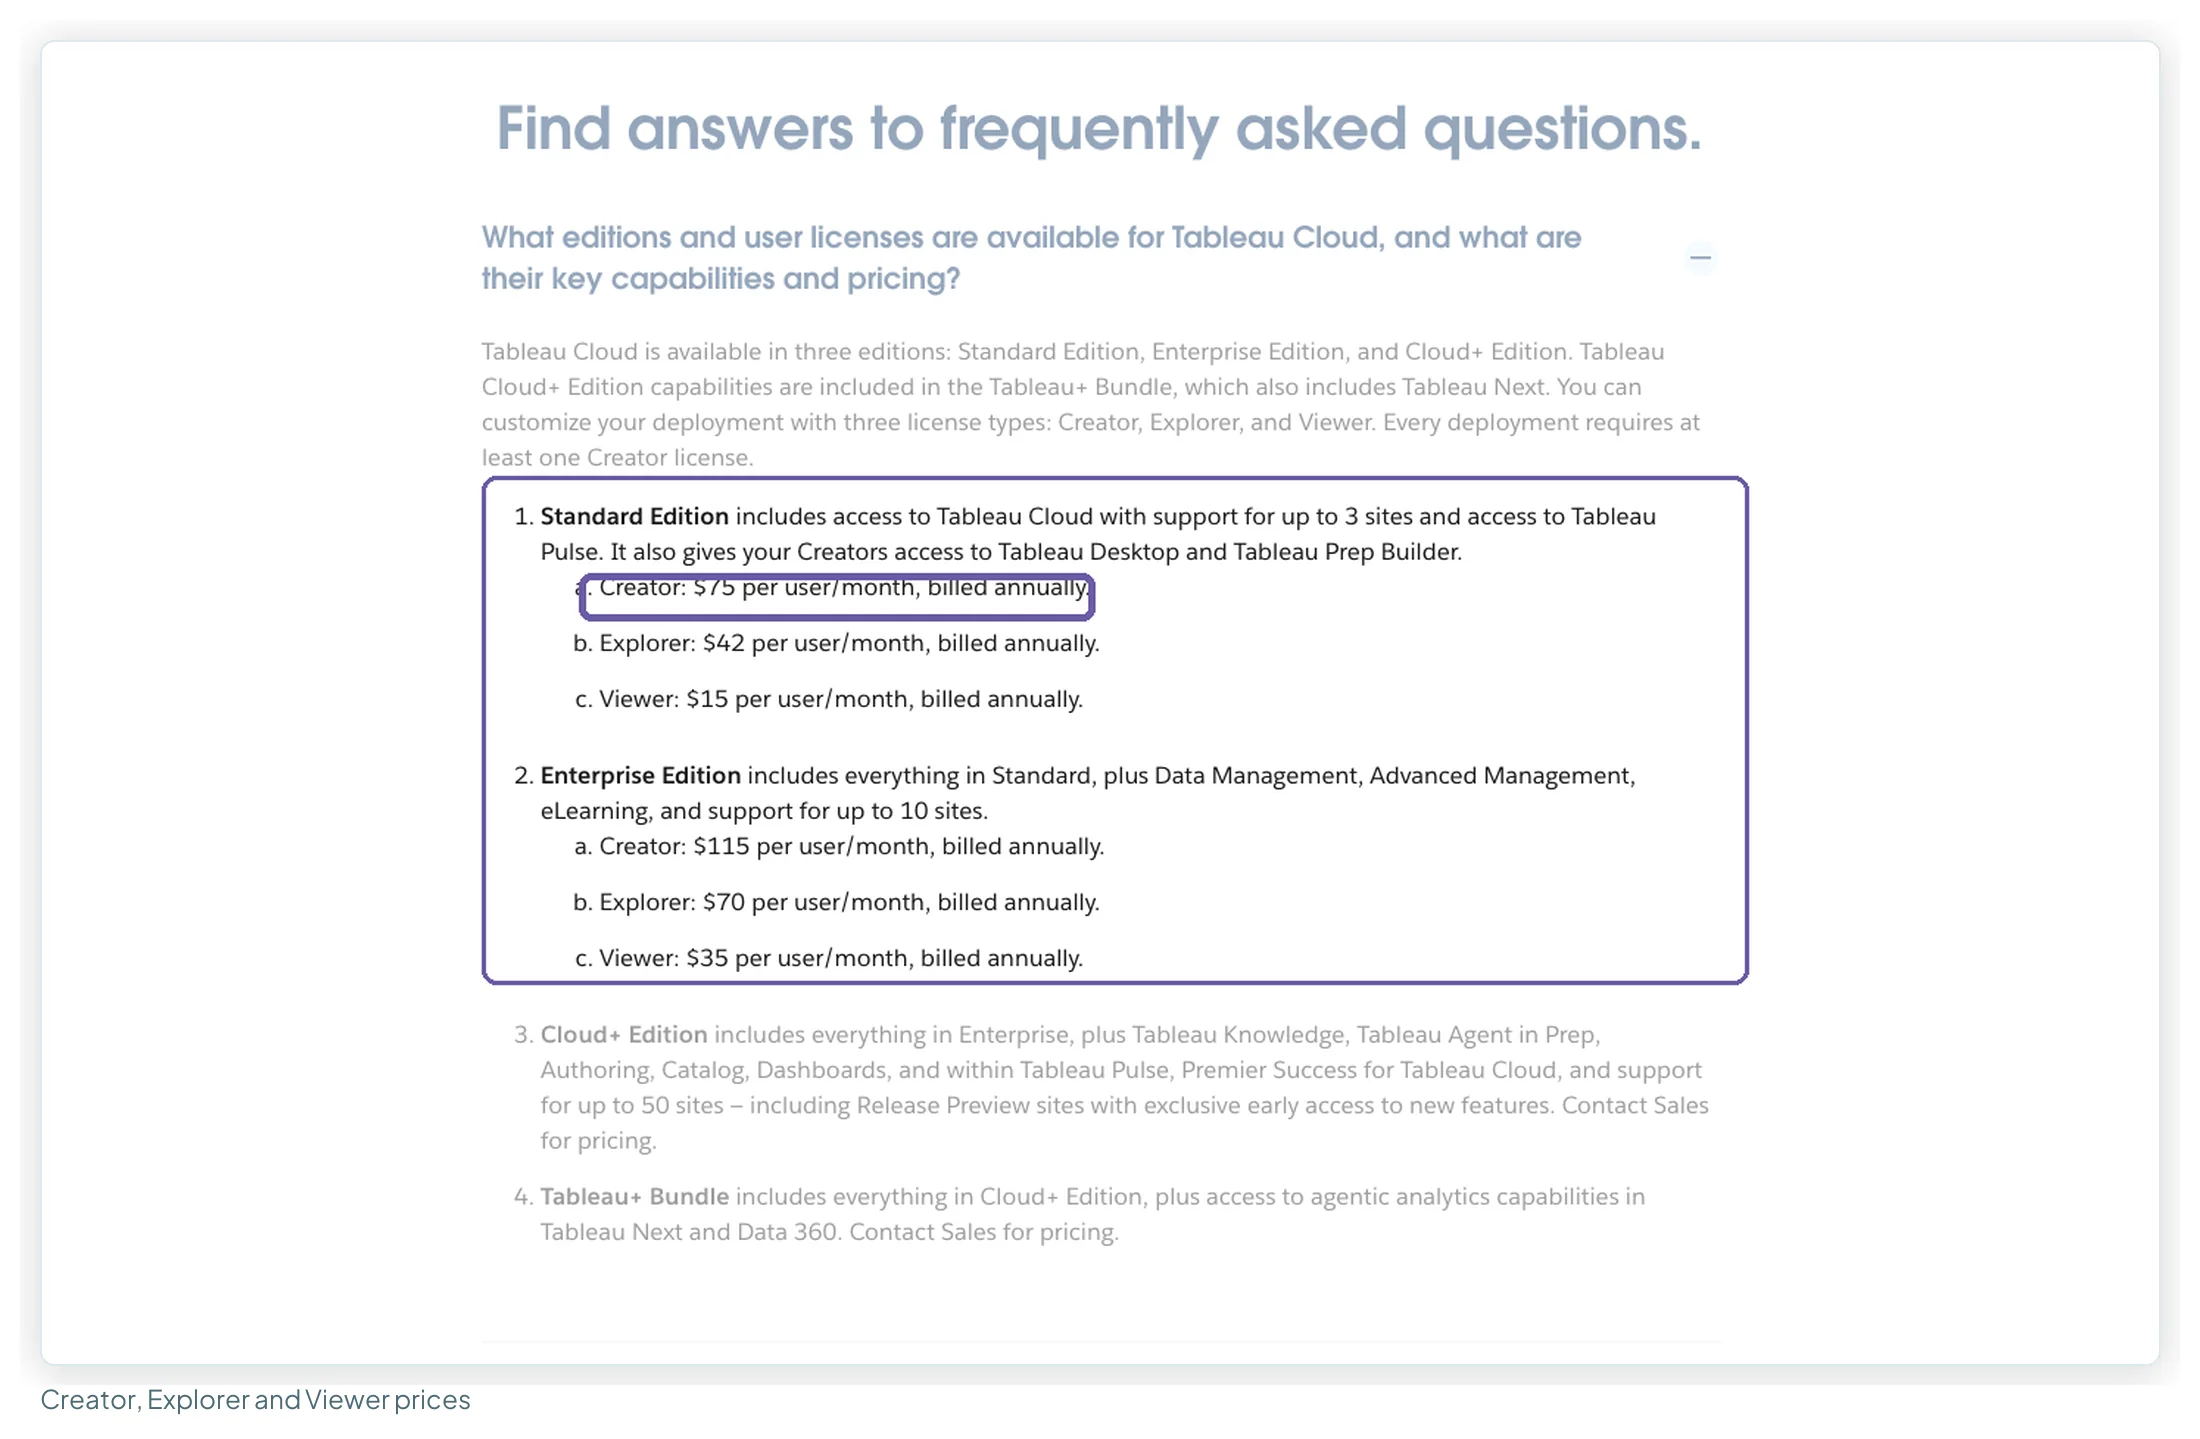
Tableau’s pricing page leads with “$15” for Standard and “$35” for Enterprise. Those are Viewer prices. Someone has to build the reports, and every deployment needs at least one Creator: $75 a month on Standard, $115 on Enterprise. Explorers, who can edit existing workbooks, are $42 and $70. Everything is billed annually on an annual contract. Cloud+ and the Tableau+ Bundle (which adds Tableau Next) are contact-sales. The free Desktop edition works on Excel, CSV and database files stored locally on your machine; sharing on Tableau Cloud needs the paid roles above.
| Plan | Price | Who it’s for |
|---|---|---|
| Data Studio | $0 | Anyone with a Google account, building and viewing |
| Data Studio Pro | $9 per user per project per month | Builders who need team workspaces and organisation-owned content |
| Power BI free account | $0 | Building only; can’t share |
| Power BI Pro | $14 per user per month, paid yearly | Builders and readers; included in Microsoft 365 E5 and Office 365 E5 |
| Power BI Premium Per User | $24 per user per month, paid yearly | Larger models, more refreshes |
| Power BI Embedded | Variable | Reports inside your own apps |
| Tableau Desktop Free Edition | $0 | Local files only |
| Tableau Standard | Creator $75 · Explorer $42 · Viewer $15, billed annually | Up to 3 sites |
| Tableau Enterprise | Creator $115 · Explorer $70 · Viewer $35, billed annually | Adds Data Management and Advanced Management, 10 sites |
| Tableau Cloud+ / Tableau+ Bundle | Contact sales | Tableau Agent, Tableau Next, 50 sites |
Prices checked 13 October 2026 on each vendor’s pricing page.
What it costs to share a report
Once the report is built, a client, a CMO or twenty colleagues need to read it. This is where the three tools differ most:
- Data Studio: readers need a Google sign-in or a link, depending on the report’s sharing settings, and no licence. Readers of Pro reports don’t need a Pro licence either.
- Power BI: every reader needs Pro, unless the content sits on Premium P1 or Fabric F64 capacity or above, where people can read reports without a paid per-user licence. A Pro licence is still needed to publish to that capacity.
- Tableau: every reader needs a Viewer licence on role-based pricing. Capacity-based pricing (blocks of Viewers) is sold through sales, aimed at large and external audiences.
For one author, as the audience grows:
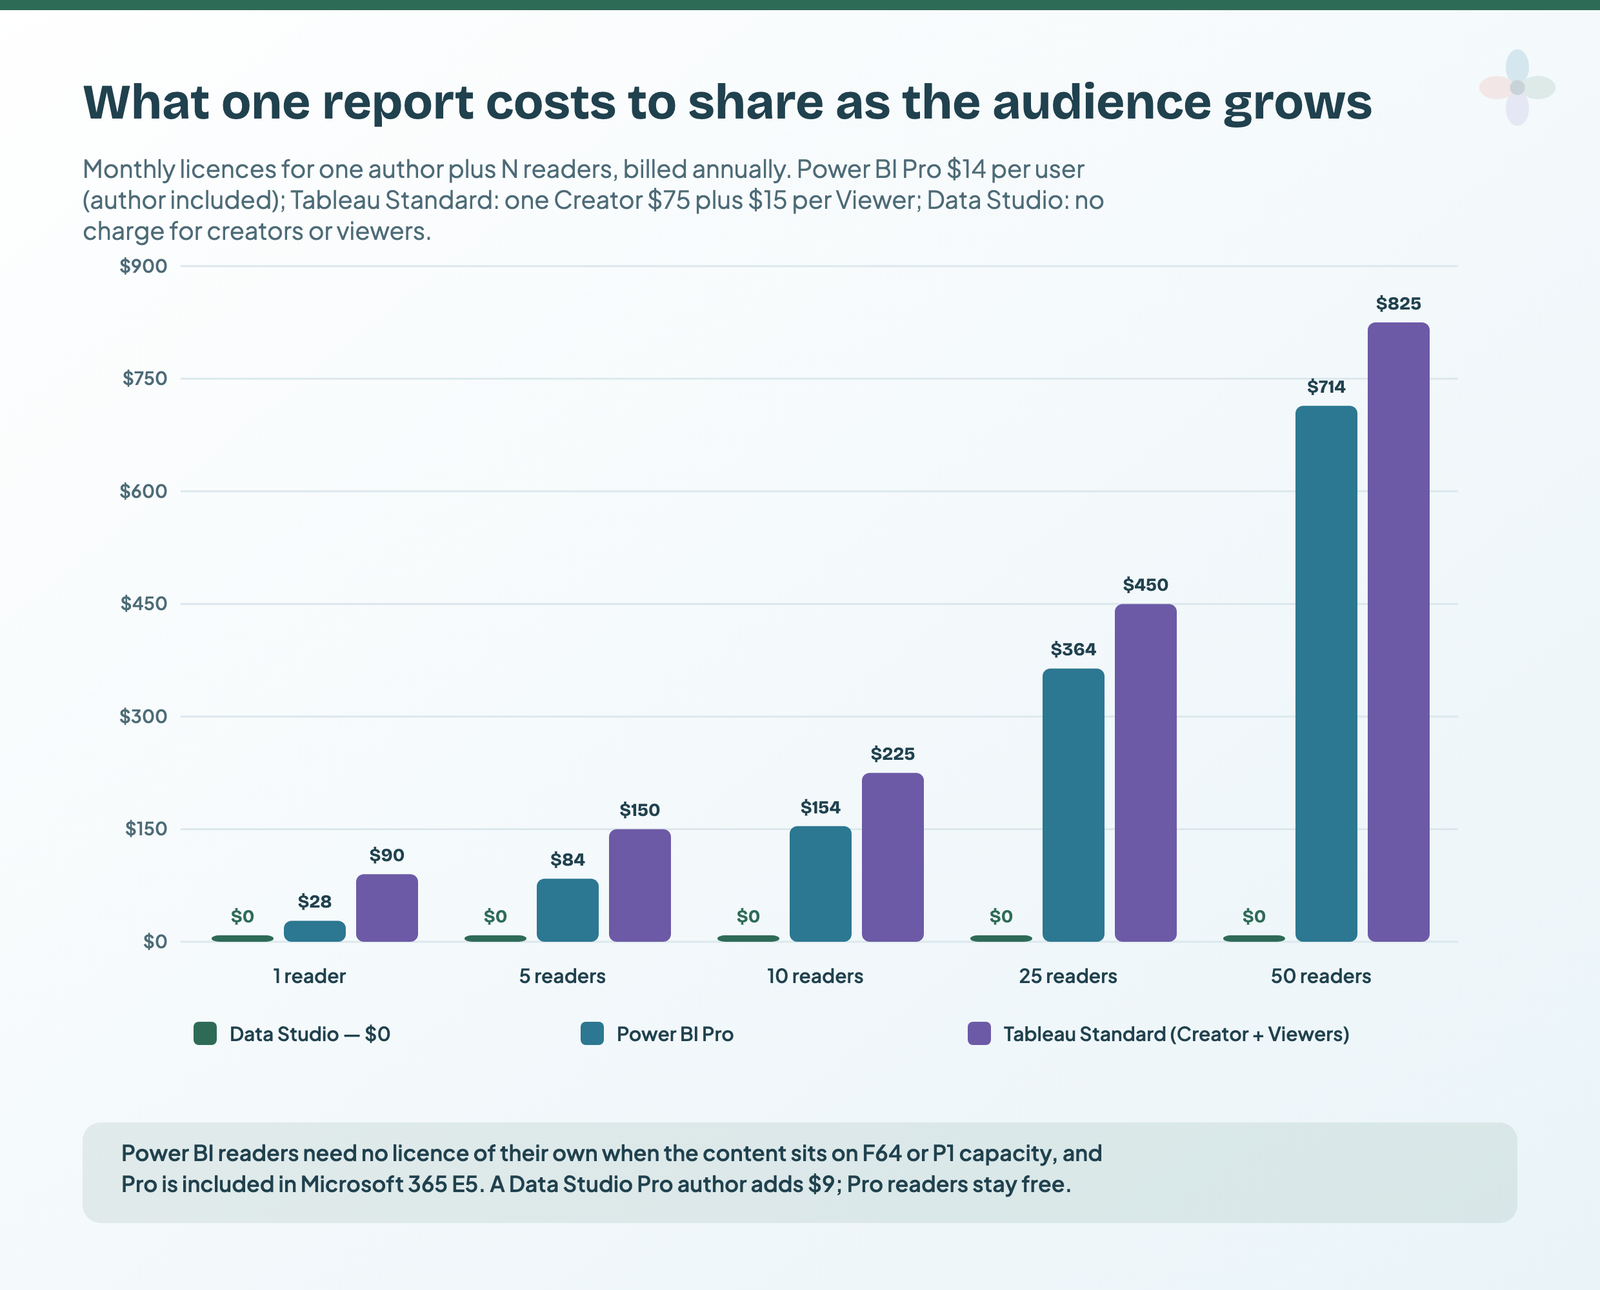
Two things narrow that gap in practice. If your company runs on Microsoft 365 E5, Pro is already included for everyone, so the Power BI line is mostly paid for. And at hundreds of readers, Power BI’s F64/P1 capacity and Tableau’s Viewer blocks change the maths. Neither capacity price is published, so I haven’t charted them. E5 covers people in your own organisation, so readers outside it, such as clients, still need a Pro licence each unless the content sits on capacity.
In Data Studio, every sharing route sits behind one button:

“Free” has a limit worth stating, though: Data Studio’s free connectors cover Google’s products. A report that also pulls Meta, LinkedIn or TikTok needs a partner connector, and most of those charge a subscription. The connector comparison prices them. That cost is per connector plan rather than per reader, but it belongs in the budget.
Which marketing sources each one connects to natively
A connector is the piece that pulls data from a platform into the reporting tool. For marketers this section matters as much as price. I read each vendor’s own connector list rather than the totals quoted in articles, which range from “150+” to “500+” for Power BI with no source given.
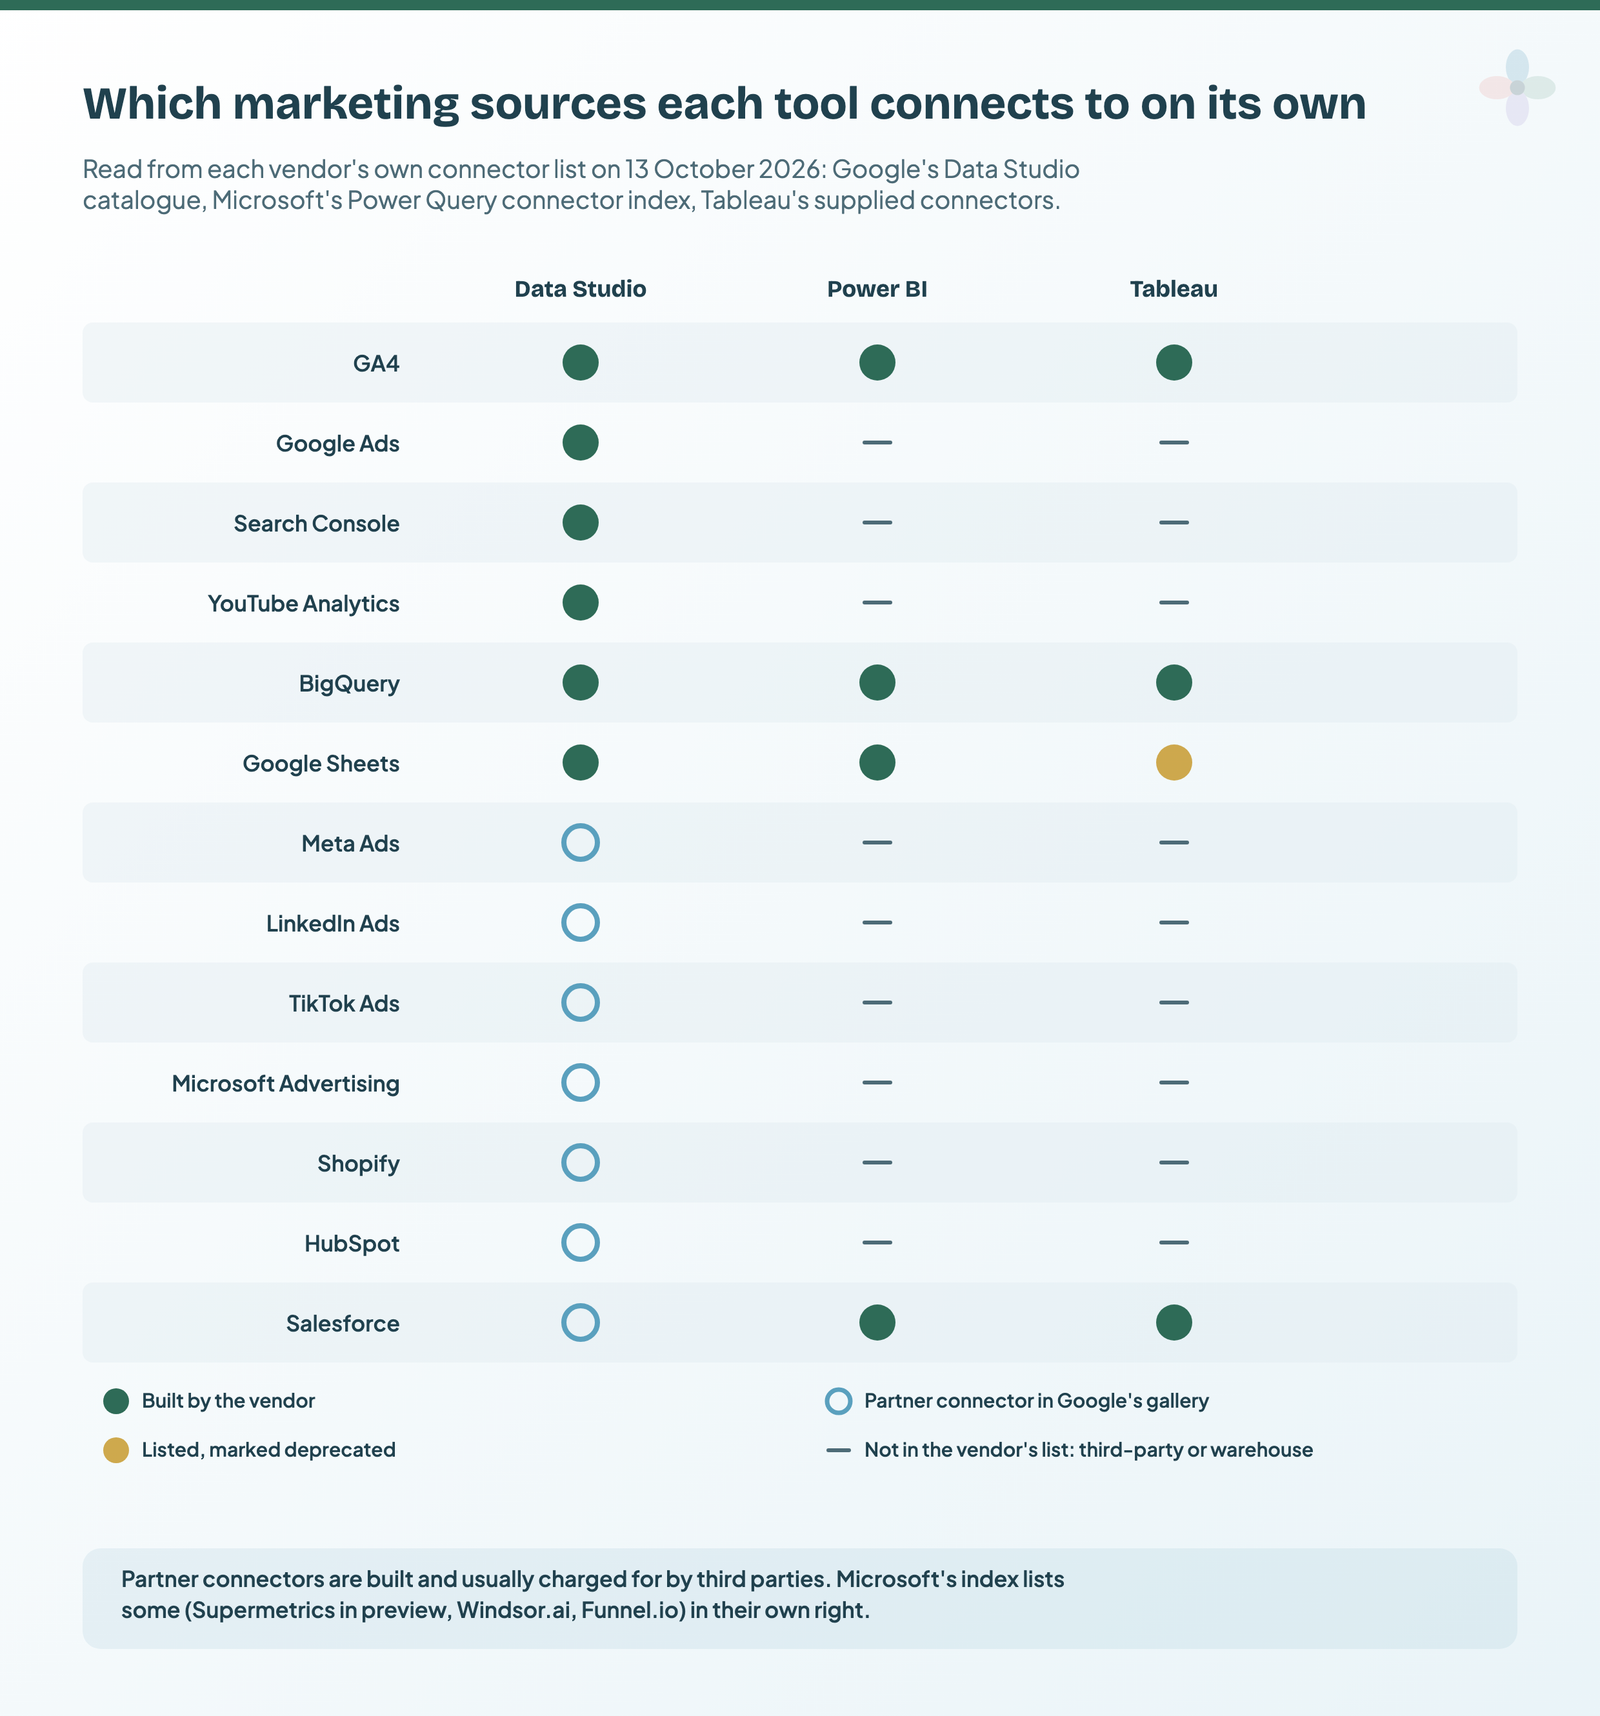
GA4 is native everywhere. Google Ads and Search Console are native only in Data Studio. Microsoft’s connector index has no Google Ads, Search Console, Meta, LinkedIn Ads (only Sales Navigator and LinkedIn Learning), TikTok or, perhaps surprisingly, Microsoft Advertising. Tableau’s supplied list has the same gaps, and marks its Google Sheets connector as deprecated. In the other direction, Salesforce is native in both Power BI and Tableau, and only partner-built in Data Studio.
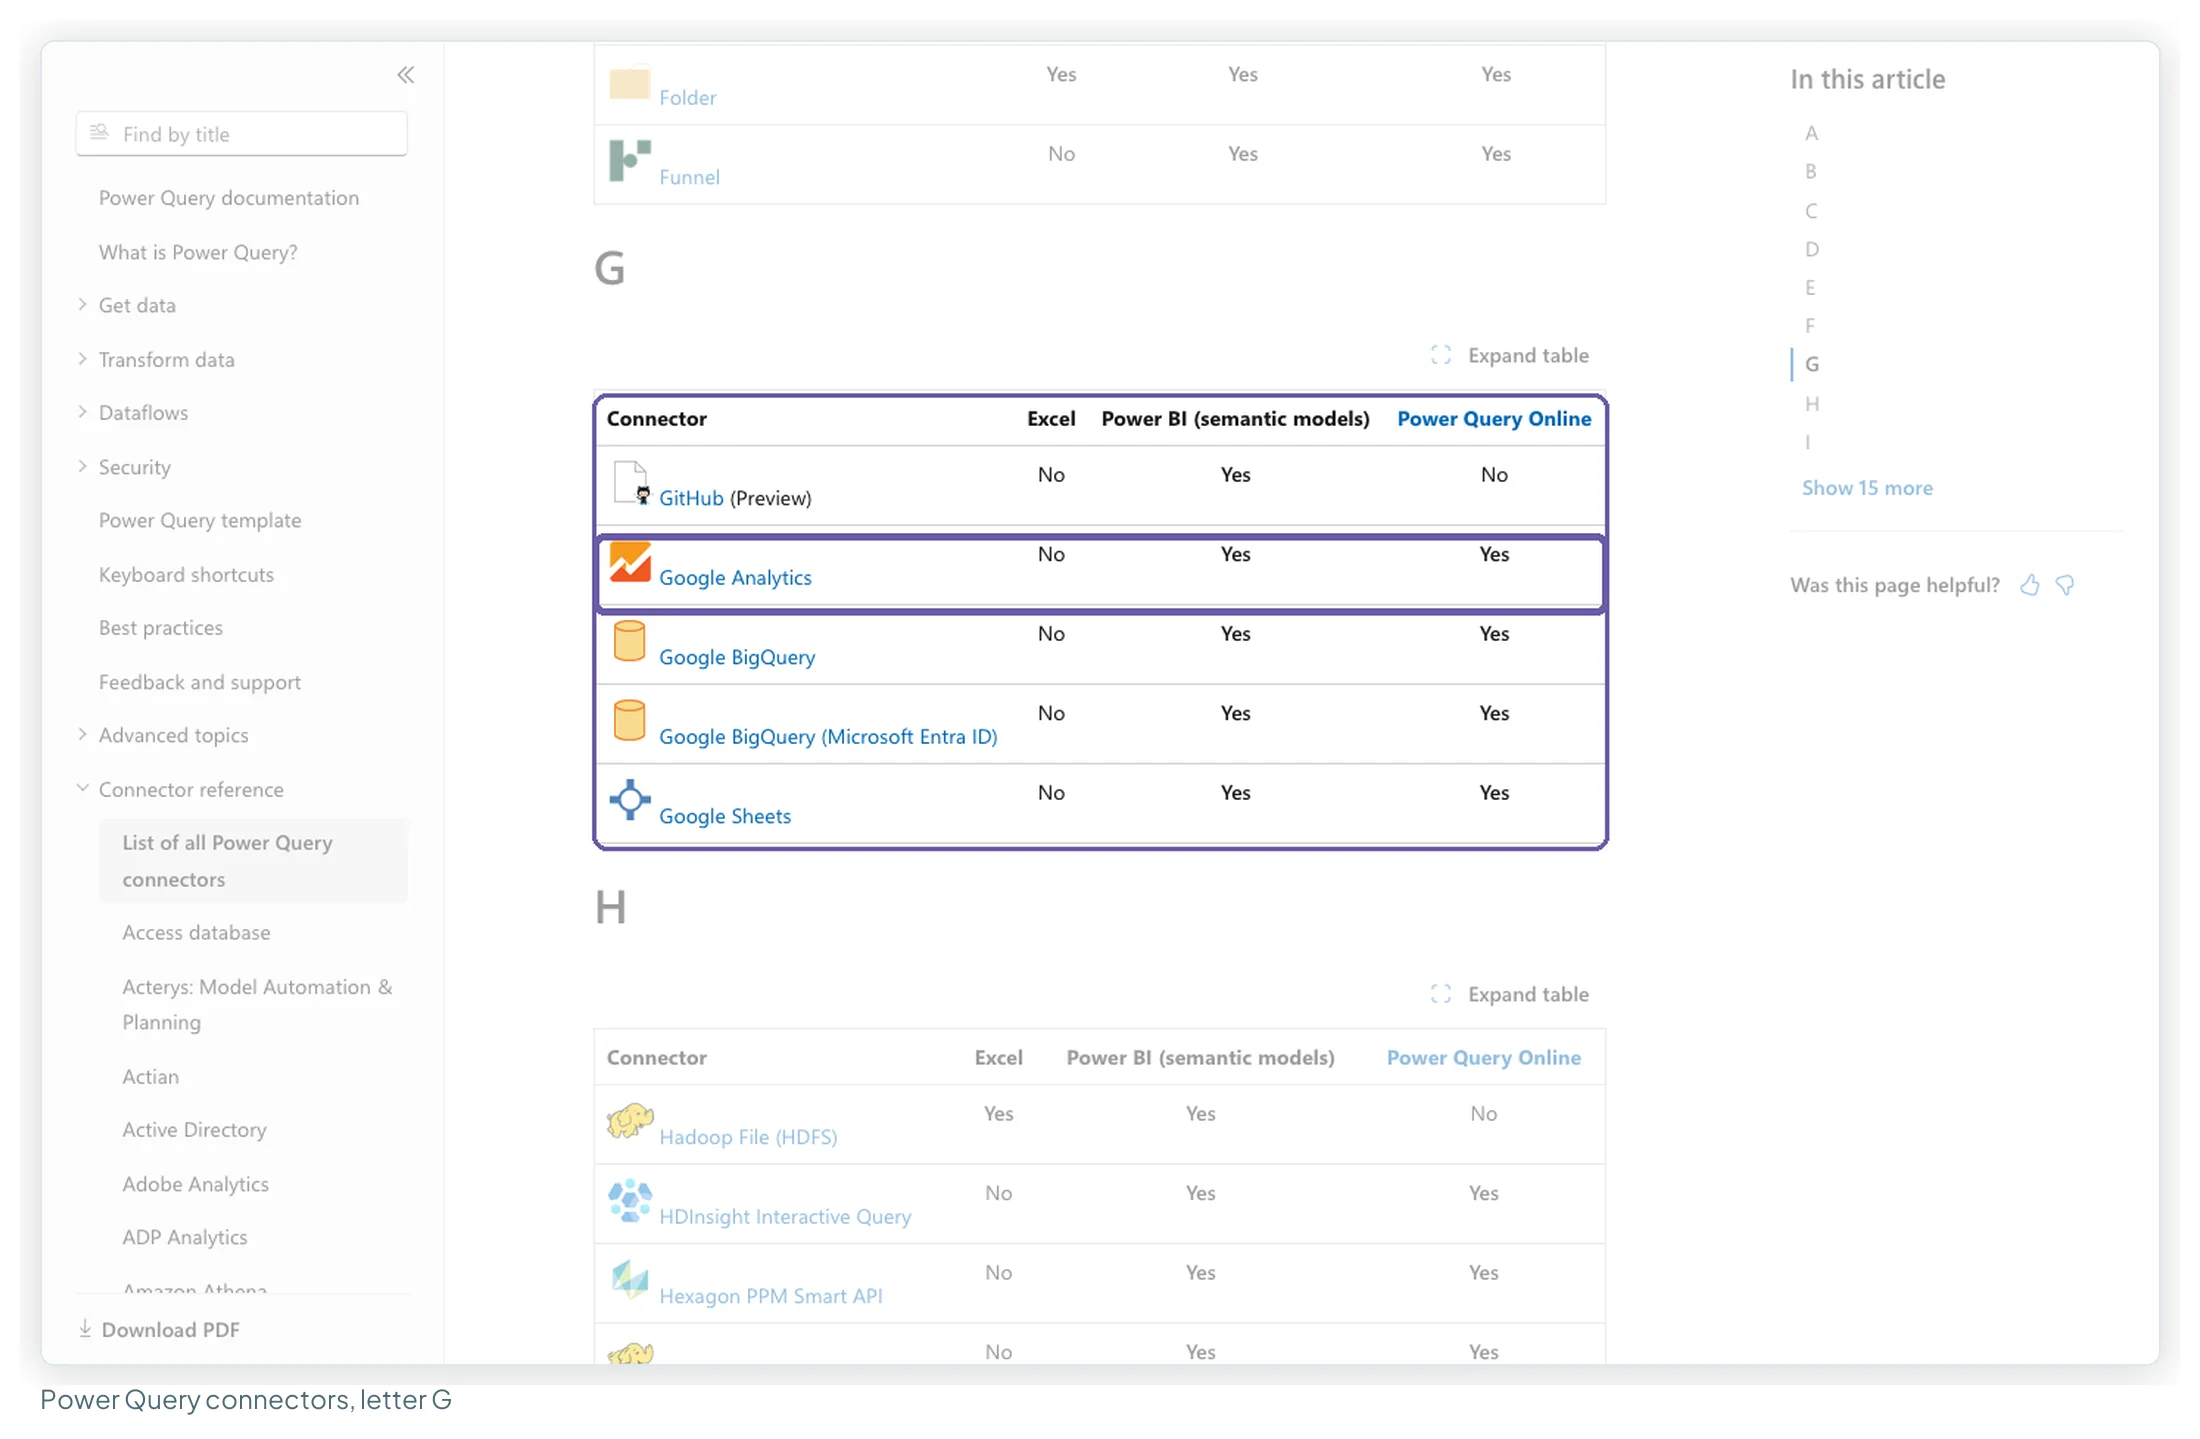
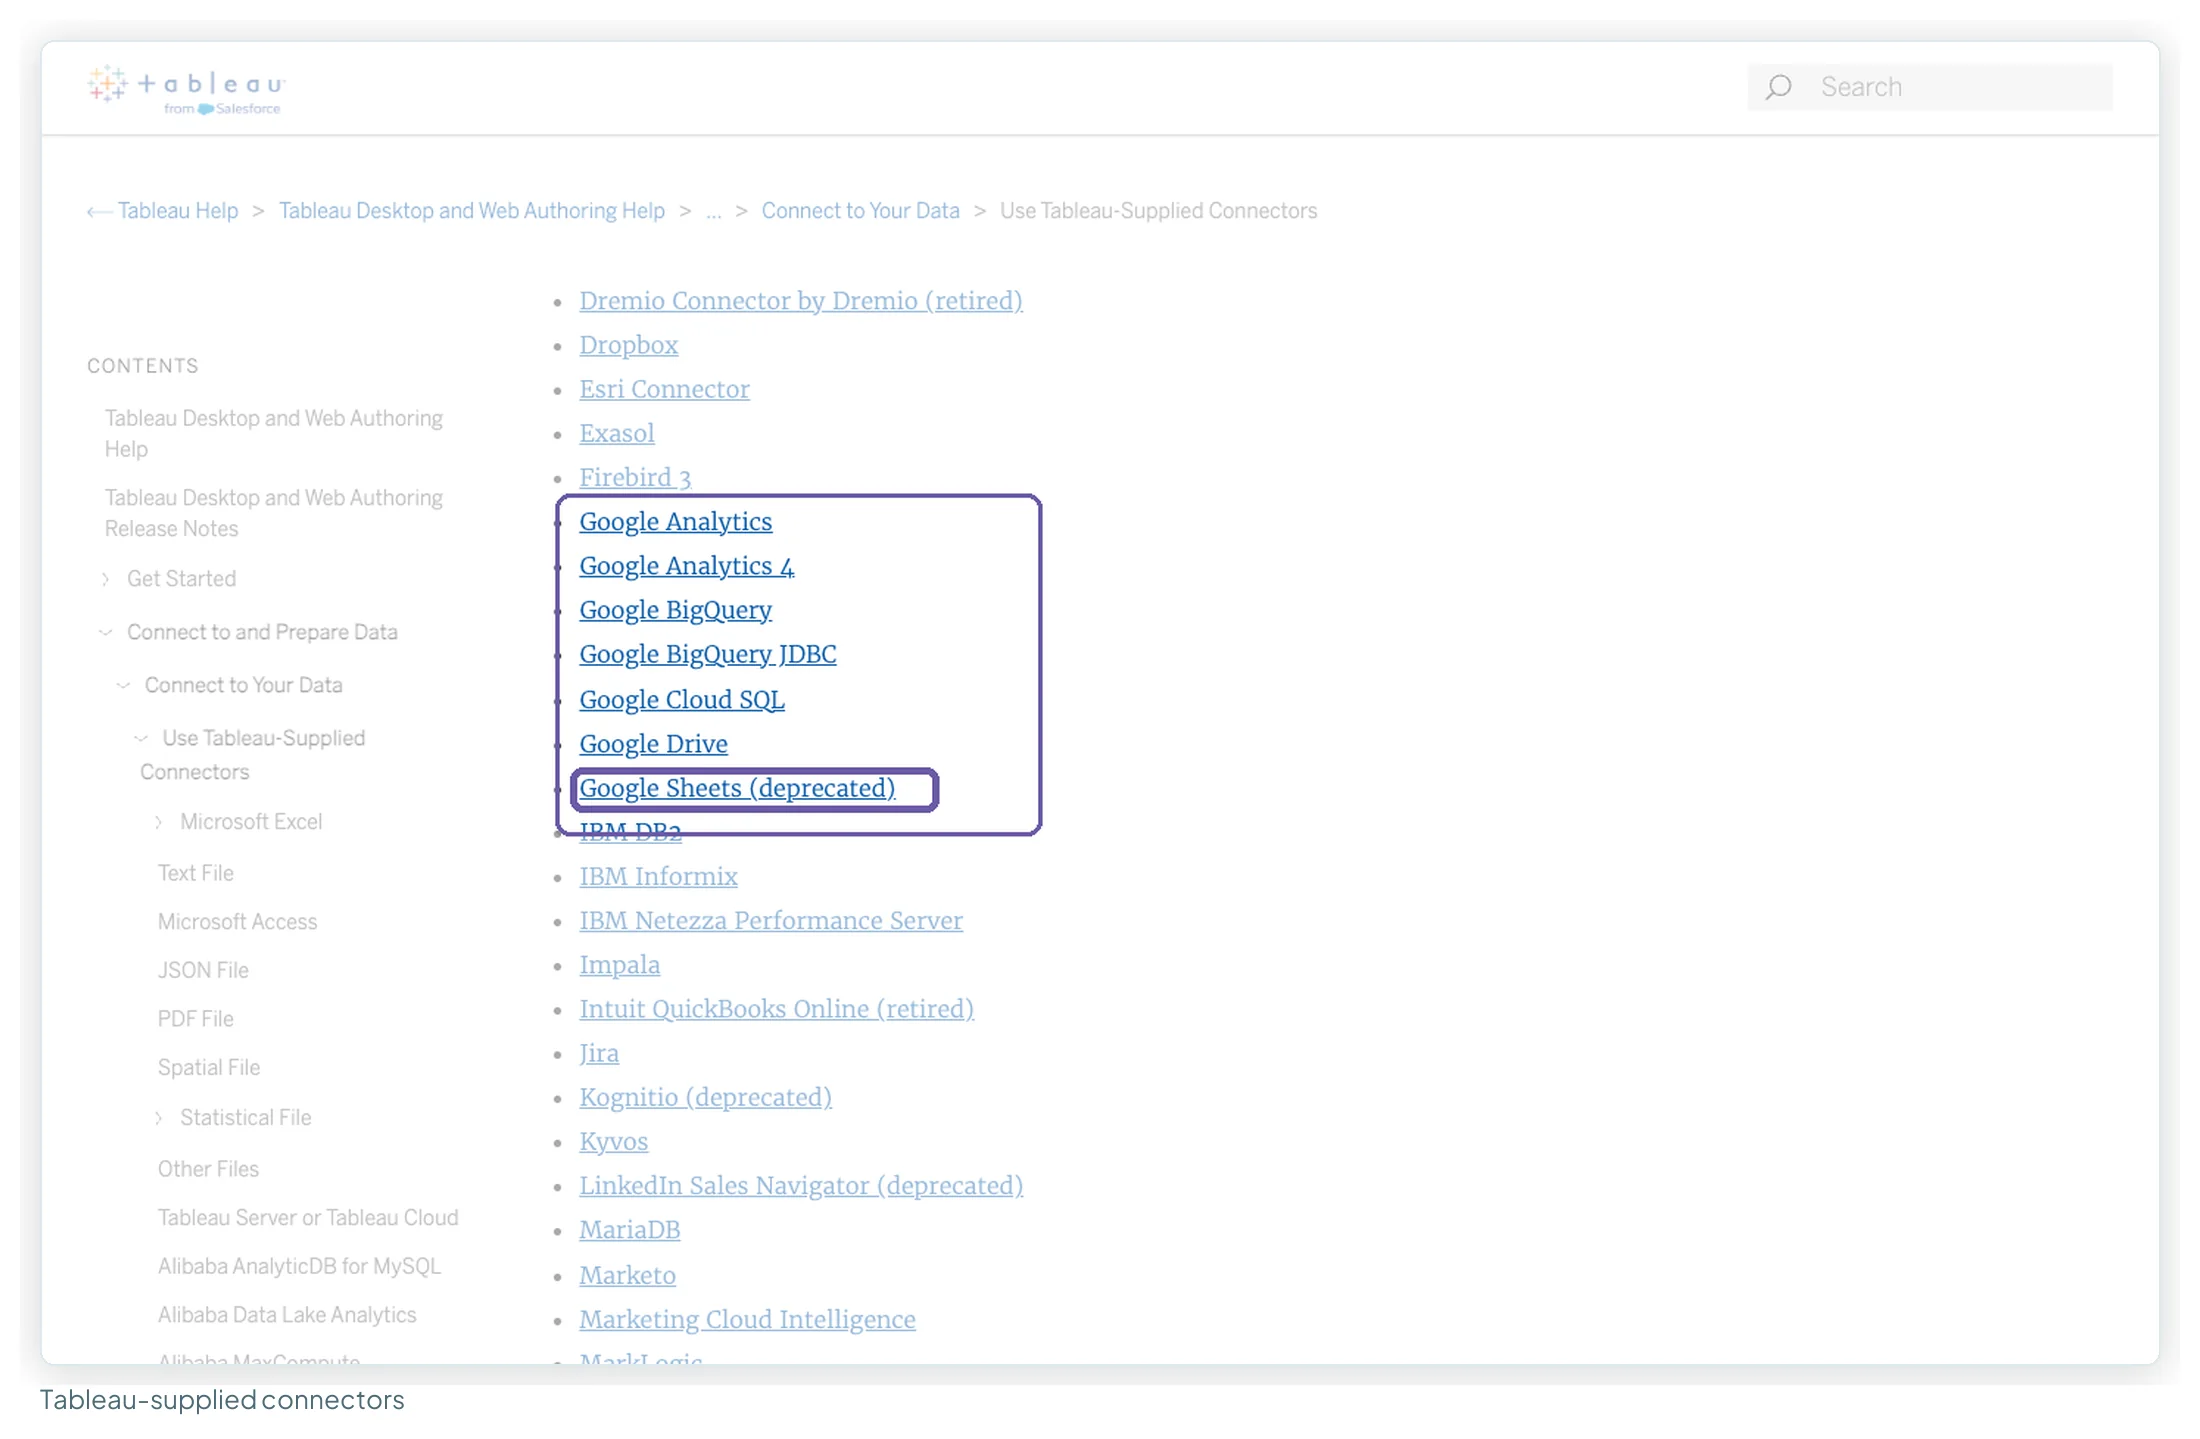
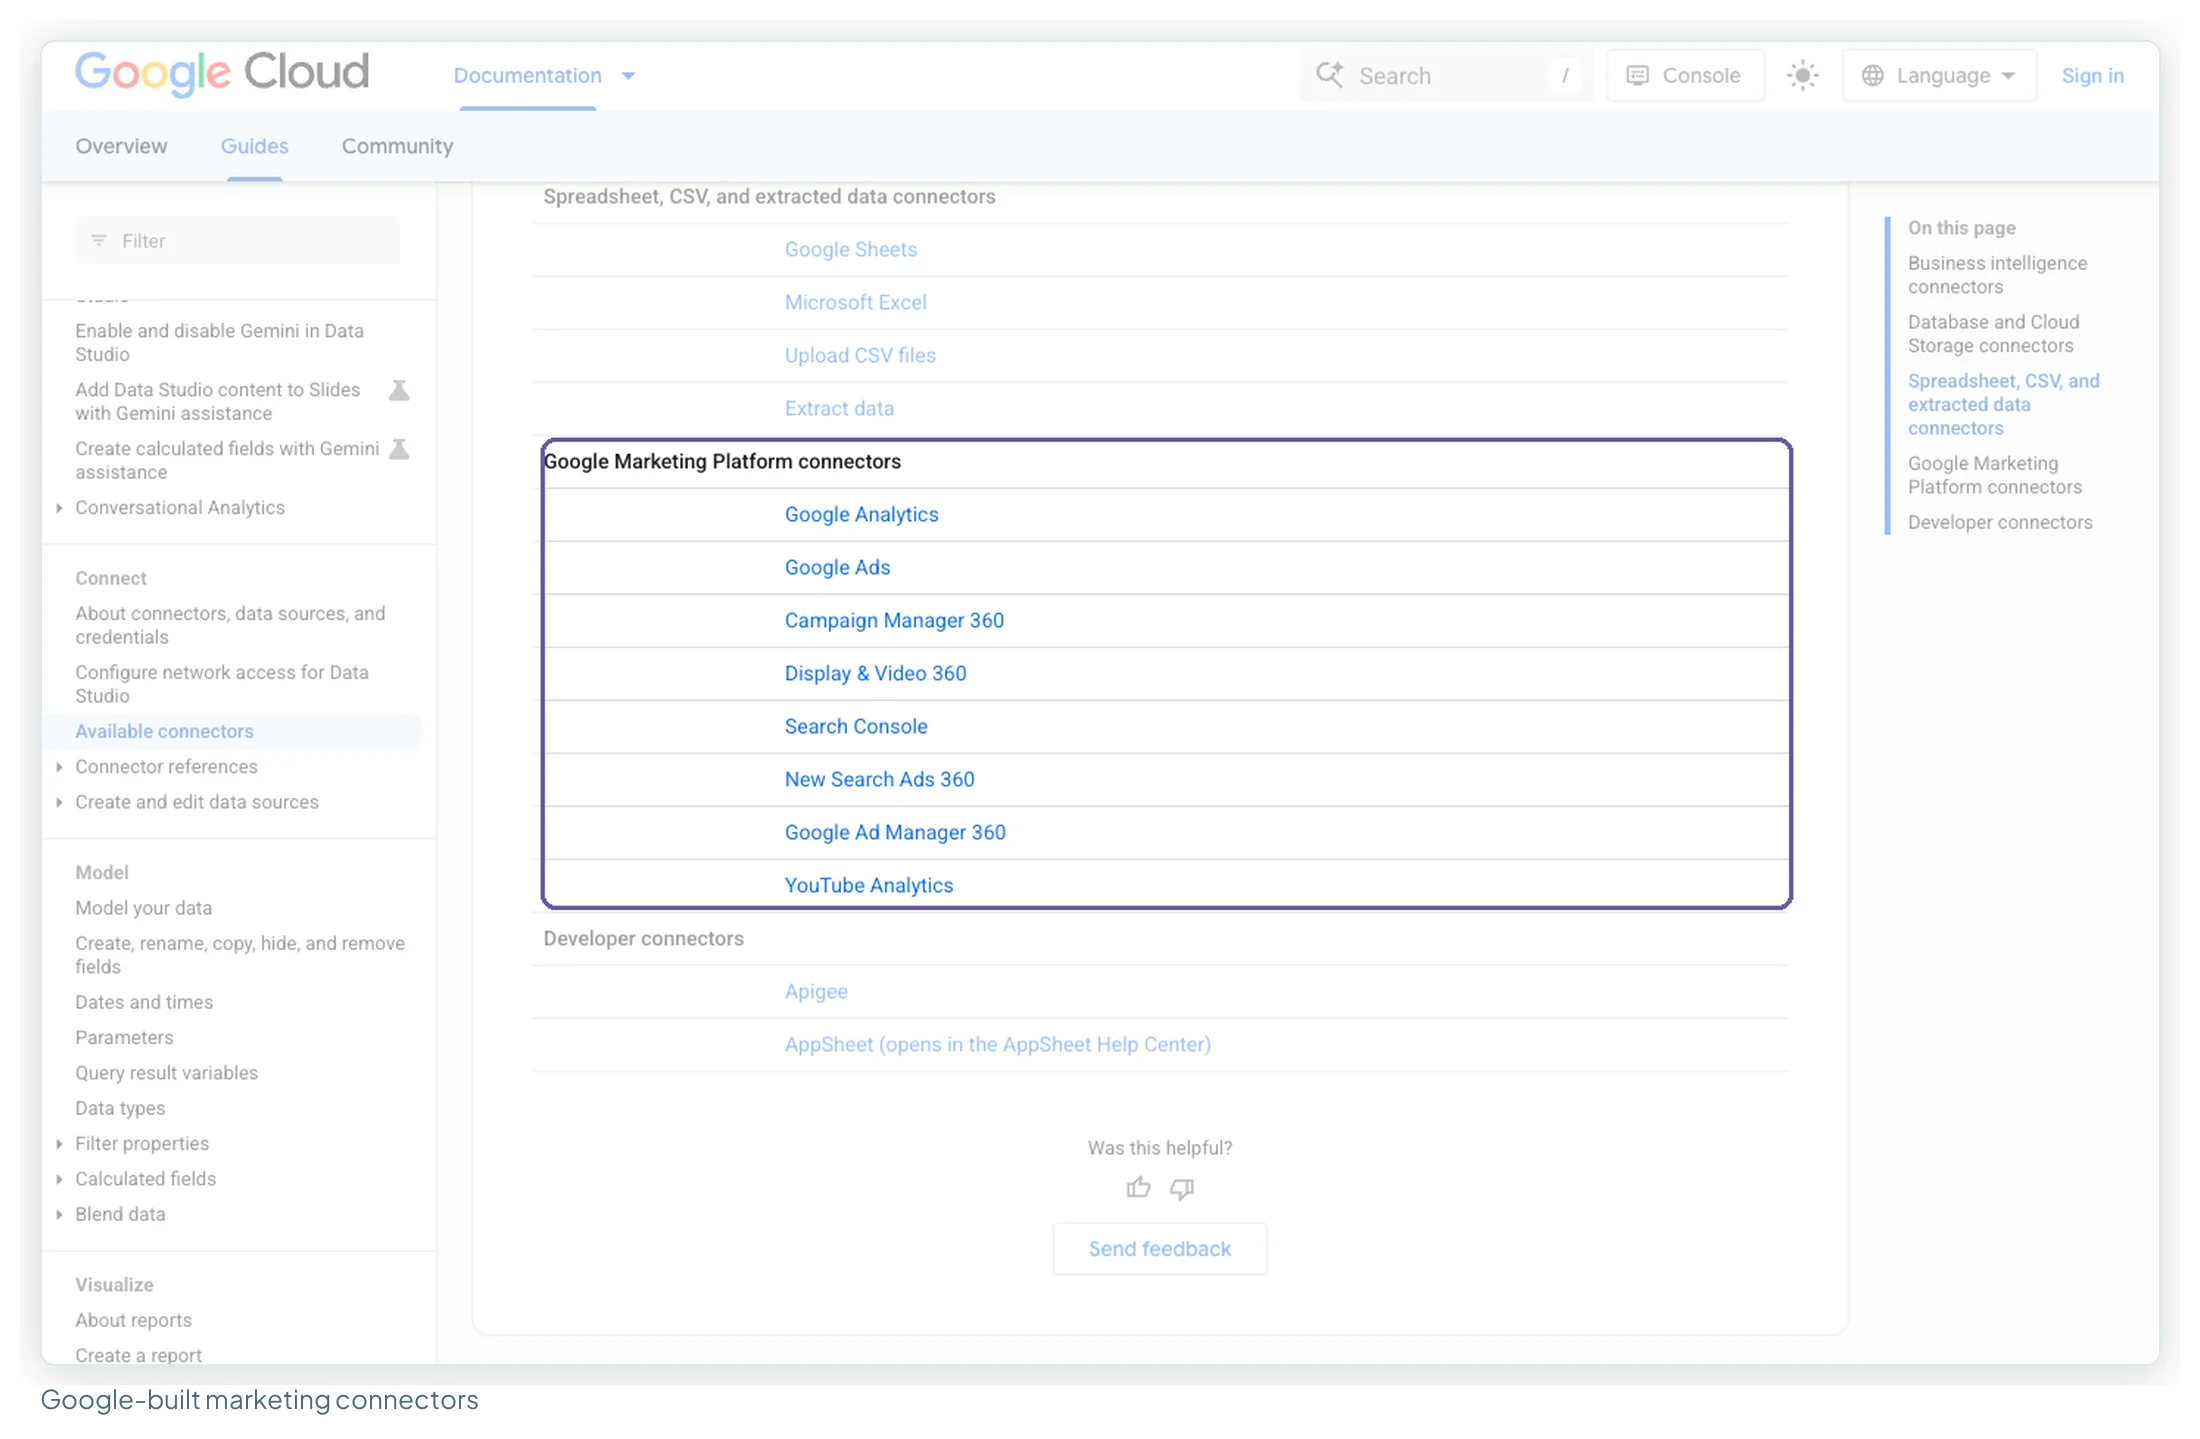
So all three need help for paid social. The difference is where that help comes from. Data Studio’s gallery lists partner connectors for Meta, LinkedIn, TikTok and the rest, built and usually charged for by third parties (Google says it makes “no promises” about them). In Power BI and Tableau, the route is a third-party connector or a warehouse such as BigQuery, which both connect to natively. Microsoft’s index includes some connector vendors directly, among them Supermetrics (in preview), Windsor.ai and Funnel.io.
How fresh the data is
| Limit | Data Studio | Power BI | Tableau |
|---|---|---|---|
| Google Ads, Search Console, YouTube | Every 12 hours, can’t be changed | Via a third-party connector; depends on it | Via a third-party connector; depends on it |
| GA4 | Every 1, 4 or 12 hours in Google’s table | Within the dataset refresh limit | Not stated on the pricing pages |
| Google Sheets | From every 15 minutes | Within the dataset refresh limit | Connector deprecated |
| Dataset refreshes per day | Set per data source (above) | 8 (Pro) · 48 (Premium Per User) | Not stated on the pricing pages |
| Reader-triggered refresh | Yes, if the editor allows it (since June 2026) | Not covered here | Not covered here |
Data Studio’s 12-hour cycle on Google’s ad products is fixed, and it’s the limit people notice when they check a report against the Google Ads interface in the morning. Check GA4 in your own data source: Google’s table offers 1, 4 or 12 hours, but the sentence above it lists Google Analytics as fixed at 12. I’ve covered what controls how fresh a Data Studio report is separately.
Data modelling: DAX, LOD and blends
A data model is the layer where tables are related to each other and shared calculations live, so every report uses the same definition of “conversion rate”. This is the biggest functional gap between Data Studio and the other two.
- Power BI builds semantic models: tables with relationships, measures written in DAX (its formula language), and transformation in Power Query. Premium Per User adds XMLA read/write and advanced dataflows. Ten of the 35 Power BI reviews I coded praise the modelling, and it’s also behind the most common complaint (below).
- Tableau uses relationships and joins in its data sources, and reviewers point to level-of-detail (LOD) calculations for working at different grains. Tableau Semantics, its newer semantic layer, sits in the top tiers: included in the Tableau+ Bundle, and available on Cloud+ through Salesforce Foundations.
- Data Studio has calculated fields on each data source and blends: joins of up to five tables, built inside one report and not reusable in another. It has no shared semantic layer; in Google’s line-up, that’s Looker’s job.
For most marketing reports, blends are enough. Joining Search Console queries to Google Ads search terms is a typical blend:

Where blends run out is when the report needs a proper model: orders joined to campaigns joined to CRM stages, with the same measure reused across twenty reports. Five of the eleven recent Data Studio reviews I read raise blending or data-model limits, the most common complaint in that sample. One marketing mentor put it plainly: “Theres a limit of 5 sources when attempting to blend data which can be restrictive” (TrustRadius, January 2026). The usual fix is to do the joining upstream, in BigQuery or a connector’s warehouse, and keep Data Studio for the presentation. I wrote about data sources, blends and their limits in more detail.
Large data, governance and where Data Studio stops
| Area | Data Studio | Power BI | Tableau |
|---|---|---|---|
| Data volume | Extracts are “a static snapshot of up to 100 MB”; larger data stays live in BigQuery or a database | 1 GB models on Pro, 100 GB on Premium Per User | No size limit stated on the pricing pages |
| Reviewers on speed | 4 of 11 recent reviews: slow with large or complex data | 10 of 35: slow with large data or complex reports | 11 of 20 recent: slow with large data or refreshes (2 praise it) |
| Governance | Pro: organisation-owned content, IAM roles, team workspaces, CMEK, data residency | PPU: XMLA endpoint read/write, advanced dataflows and datamarts | Enterprise: Data Management and Advanced Management |
| Analysis depth | A reporting tool that does some analysis | Modelling-led analysis | Visual exploration is its core strength |
Large data slows all three, by their reviewers’ account. Tableau draws the most speed complaints in proportion. For Data Studio, the practical ceiling is the 100 MB extract. Above that, performance depends on the source behind it, which is why BigQuery is the route reviewers point to.
What Google says about where Data Studio stops
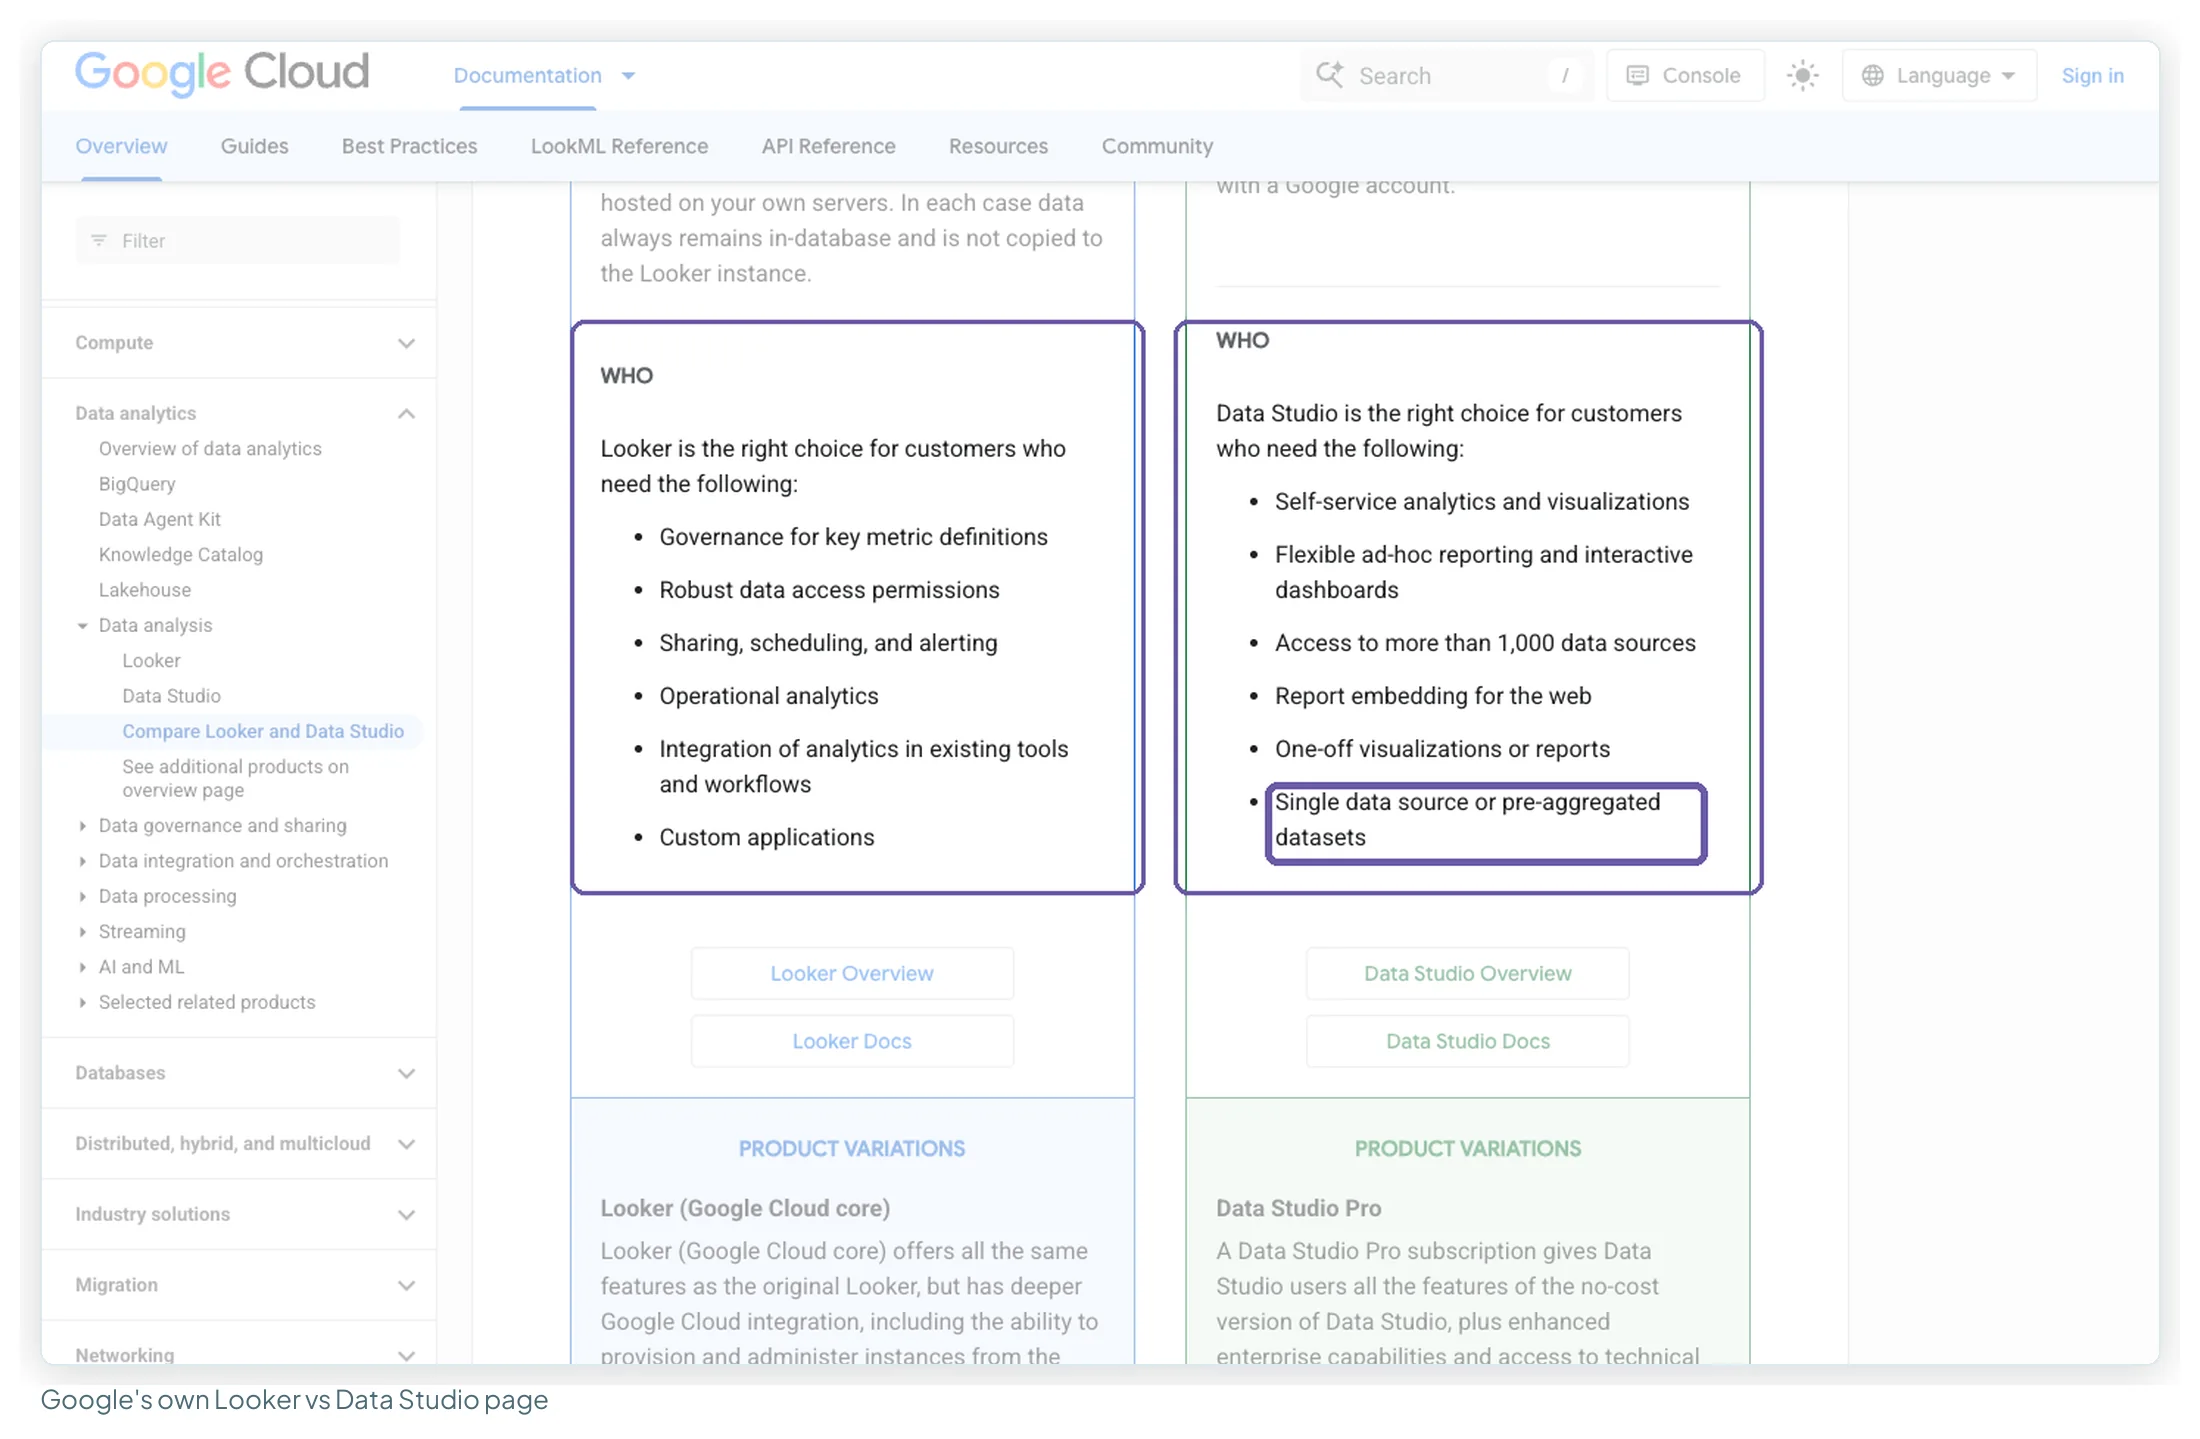
Google’s own page comparing Looker and Data Studio is unusually direct. It describes Data Studio as right for self-service analytics, ad-hoc reporting, embedding and one-off reports, and for “single data source or pre-aggregated datasets”. Looker is the one it recommends for governed metric definitions and data access permissions. If your data hasn’t been shaped yet, the fix isn’t necessarily a different dashboard tool; it’s a warehouse in front of the dashboard. How Looker fits alongside Data Studio is its own post.
Learning curve and getting started
The three tools start in different places. Data Studio runs in a browser with a Google account. Tableau offers web authoring plus Desktop and Prep Builder for Creators, and Desktop installs on Windows or Mac. Power BI’s main authoring tool, Desktop, needs Windows 10 or later. For a team on Macs that matters: 4 of the 35 Power BI reviewers raise it.
What reviewers say about effort:
- Power BI: learning curve (DAX, modelling, training) is the top complaint, in 13 of 35 reviews, with a complex interface in 11. G2’s own tags count “Learning Curve” 83 times against 148 for “Ease of Use”, so both experiences are common.
- Tableau: 7 of 20 recent reviewers call it easy to drag and drop or to teach; 5 mention a learning curve or needing an analyst.
- Data Studio: 5 of 11 recent reviewers praise how easy it is to start; 3 mention a learning curve, mostly around which metrics and dimensions to use, and 3 say a polished design takes time.
If you’re starting from zero, creating your first Data Studio report walks through it. For the other half of that learning curve, which metrics to show and which chart fits each, Chapter 9 of my ebook, Data Storytelling in Data Studio, starts from the shape of your data.
AI features, and which plan each one needs
All three now sell AI assistance, and in all three the most capable version sits above the entry price.
| Data Studio | Power BI | Tableau | |
|---|---|---|---|
| Assistant | Gemini in Data Studio | Copilot | Tableau Agent |
| What it does | Writes calculated fields from a prompt; adds report content to Google Slides with summaries (both in Preview) | Copilot in Fabric, used with Power BI reports and data | Works in Pulse, authoring, Prep and Tableau Catalog |
| Plan needed | Pro | A Fabric Copilot capacity on at least an F2 or P1 SKU | Cloud+ or the Tableau+ Bundle |
| Included lower down | Conversational Analytics (GA since 30 July 2026) for all users, with BigQuery data agents | Not without a paid capacity | Tableau Pulse and Tableau MCP in every edition |
Google’s caveat: Gemini’s Preview features are free “for a limited time”, after which you may need to pay for them separately. And Data Studio’s Conversational Analytics is free to open, but it answers through BigQuery data agents on a Google Cloud project with billing turned on: queries are billed after the first 1 TiB a month, and data tokens for data insights from 27 October 2026 and for conversations from 1 January 2027 (the costs in full).
What users say
Ratings first, with the number behind each one. All read on 13 October 2026.
| Site | Data Studio | Power BI | Tableau |
|---|---|---|---|
| Gartner Peer Insights | 4.5/5 (423 ratings) | 4.4/5 (4,143 ratings) | 4.4/5 (4,770 ratings) |
| TrustRadius | 8.2/10 (335, under its old name) | 8.5/10 (2,235) | 8.5/10 (2,335, Tableau Desktop) |
| G2 | Page blocked when read | 4.5/5 (1,661) | 4.4/5 (4,230) |
| Capterra / GetApp | Page blocked when read | GetApp 4.6/5 (1,893) | Capterra 4.6/5 (2,362) |
The ratings are close; the volume isn’t: thousands of reviews each for Power BI and Tableau, hundreds for Data Studio on the sites I could read. G2 and Capterra blocked reading for Data Studio, and the GetApp and Capterra figures come from Google’s result snippets.
What people praise and complain about, from the coded sample:
| Data Studio (11 recent reviews) | Power BI (35 reviews) | Tableau (20 recent reviews) | |
|---|---|---|---|
| Top praise | Easy sharing with clients and stakeholders (6) | Interactive dashboards and visuals (20) | Visual quality and interactive dashboards (14) |
| Second | Easy to start (5) | Connects and combines many sources (16) | Connects and joins many sources (11) |
| Third | Customisable reports (4) | Modelling power (10) | Easy drag-and-drop (7) |
| Top complaint | Blending and data-model limits (5) | Learning curve (13) | Slow with large data (11) |
| Second | Slow with large or complex data (4) | Complex interface (11) | Expensive licences, including for viewers (6) |
| Third | Learning curve; design takes time; fewer features than full BI (3 each) | Slow with large data (10) | Formatting and chart-type gaps (6) |
Read the Data Studio column with care: 11 recent reviews is a thin sample (32 across all years). Most reviews in all three samples are marked as incentivised (18 of 35 for Power BI, 16 of 20 for Tableau, 24 of 32 for Data Studio). One line from each:
- Data Studio: “It’s a tool that clients can access easily” (Head of CRO at a marketing agency, TrustRadius, February 2026).
- Power BI: “I also find the licensing and pricing structure can be a little difficult to understand” (Data Research Executive, G2, August 2026).
- Tableau: “Large datasets sometimes lag when refreshing” (Senior Manager, Performance Analytics, TrustRadius, February 2025).
On forums, the snippets of the 24 Reddit threads I could see repeat the same three themes: Data Studio is the easy choice for Google data and beginners, non-Google sources such as Meta are where it gets harder, and people moving from Power BI miss its modelling. One r/dataanalysiscareers answer sums up the job-market angle: most people are fine starting with Power BI because of demand and low cost.
Four scenarios, priced
| Scenario | Data Studio | Power BI Pro | Tableau Standard | My pick |
|---|---|---|---|---|
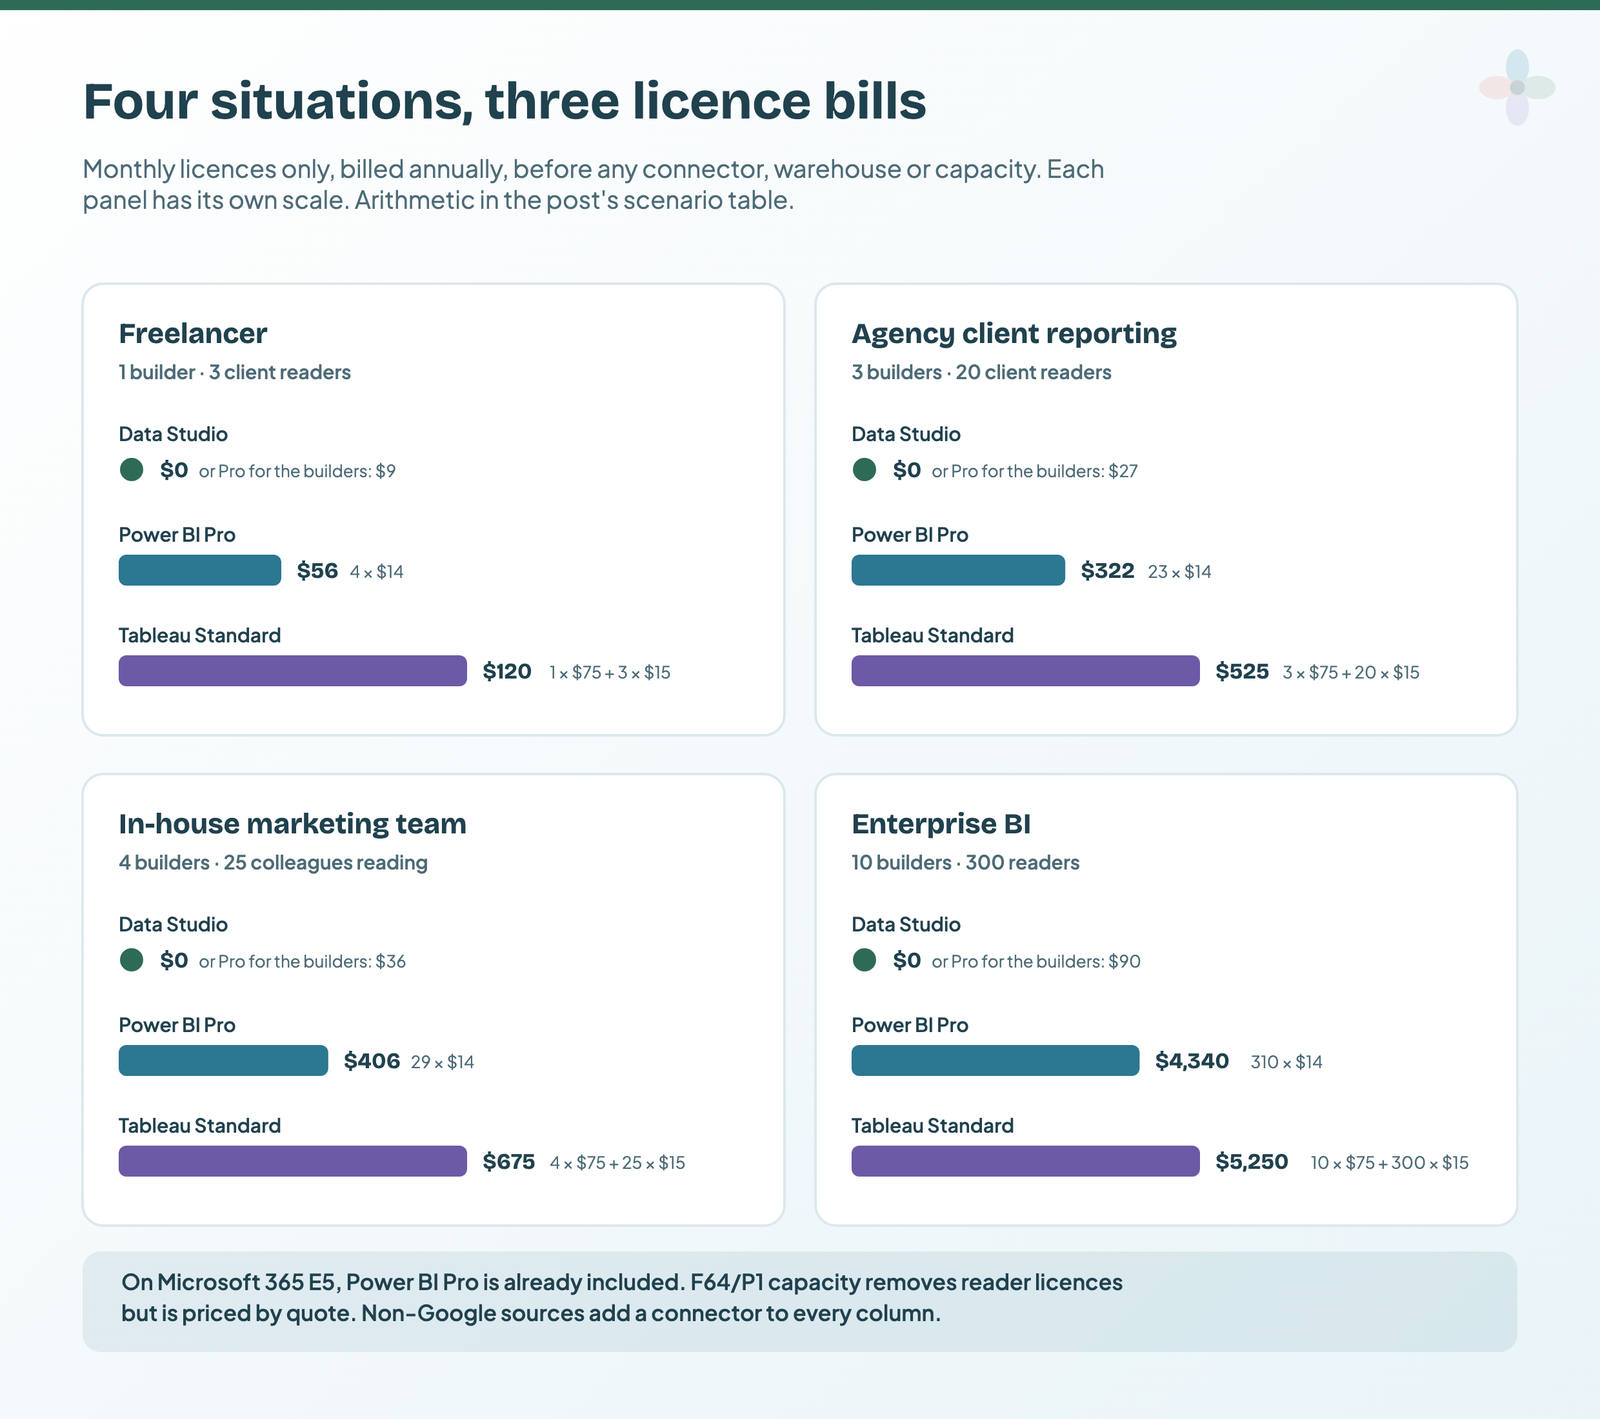
| Freelancer: 1 builder, 3 client readers | $0 (Pro $9) | 4 × $14 = $56 | $75 + 3 × $15 = $120 | Data Studio, unless clients already hold Power BI licences |
| Agency client reporting: 3 builders, 20 client readers | $0 (Pro 3 × $9 = $27) | 23 × $14 = $322 | 3 × $75 + 20 × $15 = $525 | Data Studio; Pro if reports must belong to the agency |
| In-house marketing team: 4 builders, 25 colleagues | $0 (Pro 4 × $9 = $36) | 29 × $14 = $406, or $0 extra on Microsoft 365 E5 | 4 × $75 + 25 × $15 = $675 | Power BI if the company is on E5 or needs a shared model; Data Studio if not |
| Enterprise BI: 10 builders, 300 readers | $0 (Pro 10 × $9 = $90) | 310 × $14 = $4,340, or F64 capacity (quote) | 10 × $75 + 300 × $15 = $5,250, or Viewer blocks (quote) | Power BI or Tableau, run by a data team; Looker is the Google option |
Monthly, billed annually, from prices checked 13 October 2026. Power BI Pro is $168 per user per year; a Tableau Standard Creator is $900.
Freelancer
A freelancer reporting GA4, Google Ads and Search Console to three clients pays nothing in Data Studio and sends each client a link. The same setup costs $56 a month on Power BI, and $120 on Tableau with an annual contract. Meta Ads would need a connector in any of the three; Power BI and Tableau need one for Google Ads too.
Agency client reporting
Client readers sit outside the agency, so Microsoft 365 E5 doesn’t help and every reader is a licence. That’s the scenario where Data Studio’s free readers matter most: $0 against $322 or $525 a month. The case for Pro here is ownership: with Pro, reports belong to the agency’s Cloud project instead of the person who built them.
In-house marketing team
The closest call. On Microsoft 365 E5, Power BI Pro is included and the team gets a shared model with finance and CRM data. A Google-centric team reporting on its own channels is covered by Data Studio at no cost.
Enterprise BI
At 300 readers with a data team, architecture matters more than licence arithmetic, and both capacity options are priced by quote. A team that needs Tableau’s Data Management would be on Enterprise, where the same setup is 10 × $115 + 300 × $35 = $11,650 a month. Data Studio can still serve marketing reports on top of the warehouse; Google points teams that need governed definitions to Looker.
Using more than one, and switching
You don’t have to pick one. A common setup is a modelled Power BI or Tableau estate for the business, and Data Studio reports for marketing teams, agencies and freelancers who don’t have seats.
If you’re moving between them, three things carry over and three don’t:
- Carries over: the data, if it lives in BigQuery or a connector’s warehouse (all three read BigQuery natively); your metric definitions, if they’re written down; and the report structure.
- Doesn’t: DAX measures and LOD calculations, which have to be rewritten as Data Studio calculated fields and blends (or the other way round); the reports themselves, which you rebuild in the new tool; and sharing permissions, because each tool’s licence model is different.
Moving from Power BI to Data Studio, the snag people hit first is modelling: one r/Looker thread from a Power BI convert asking whether they were “doomed” is exactly that. Moving the other way, the snag is licensing every reader.
What free reporting looks like in Data Studio
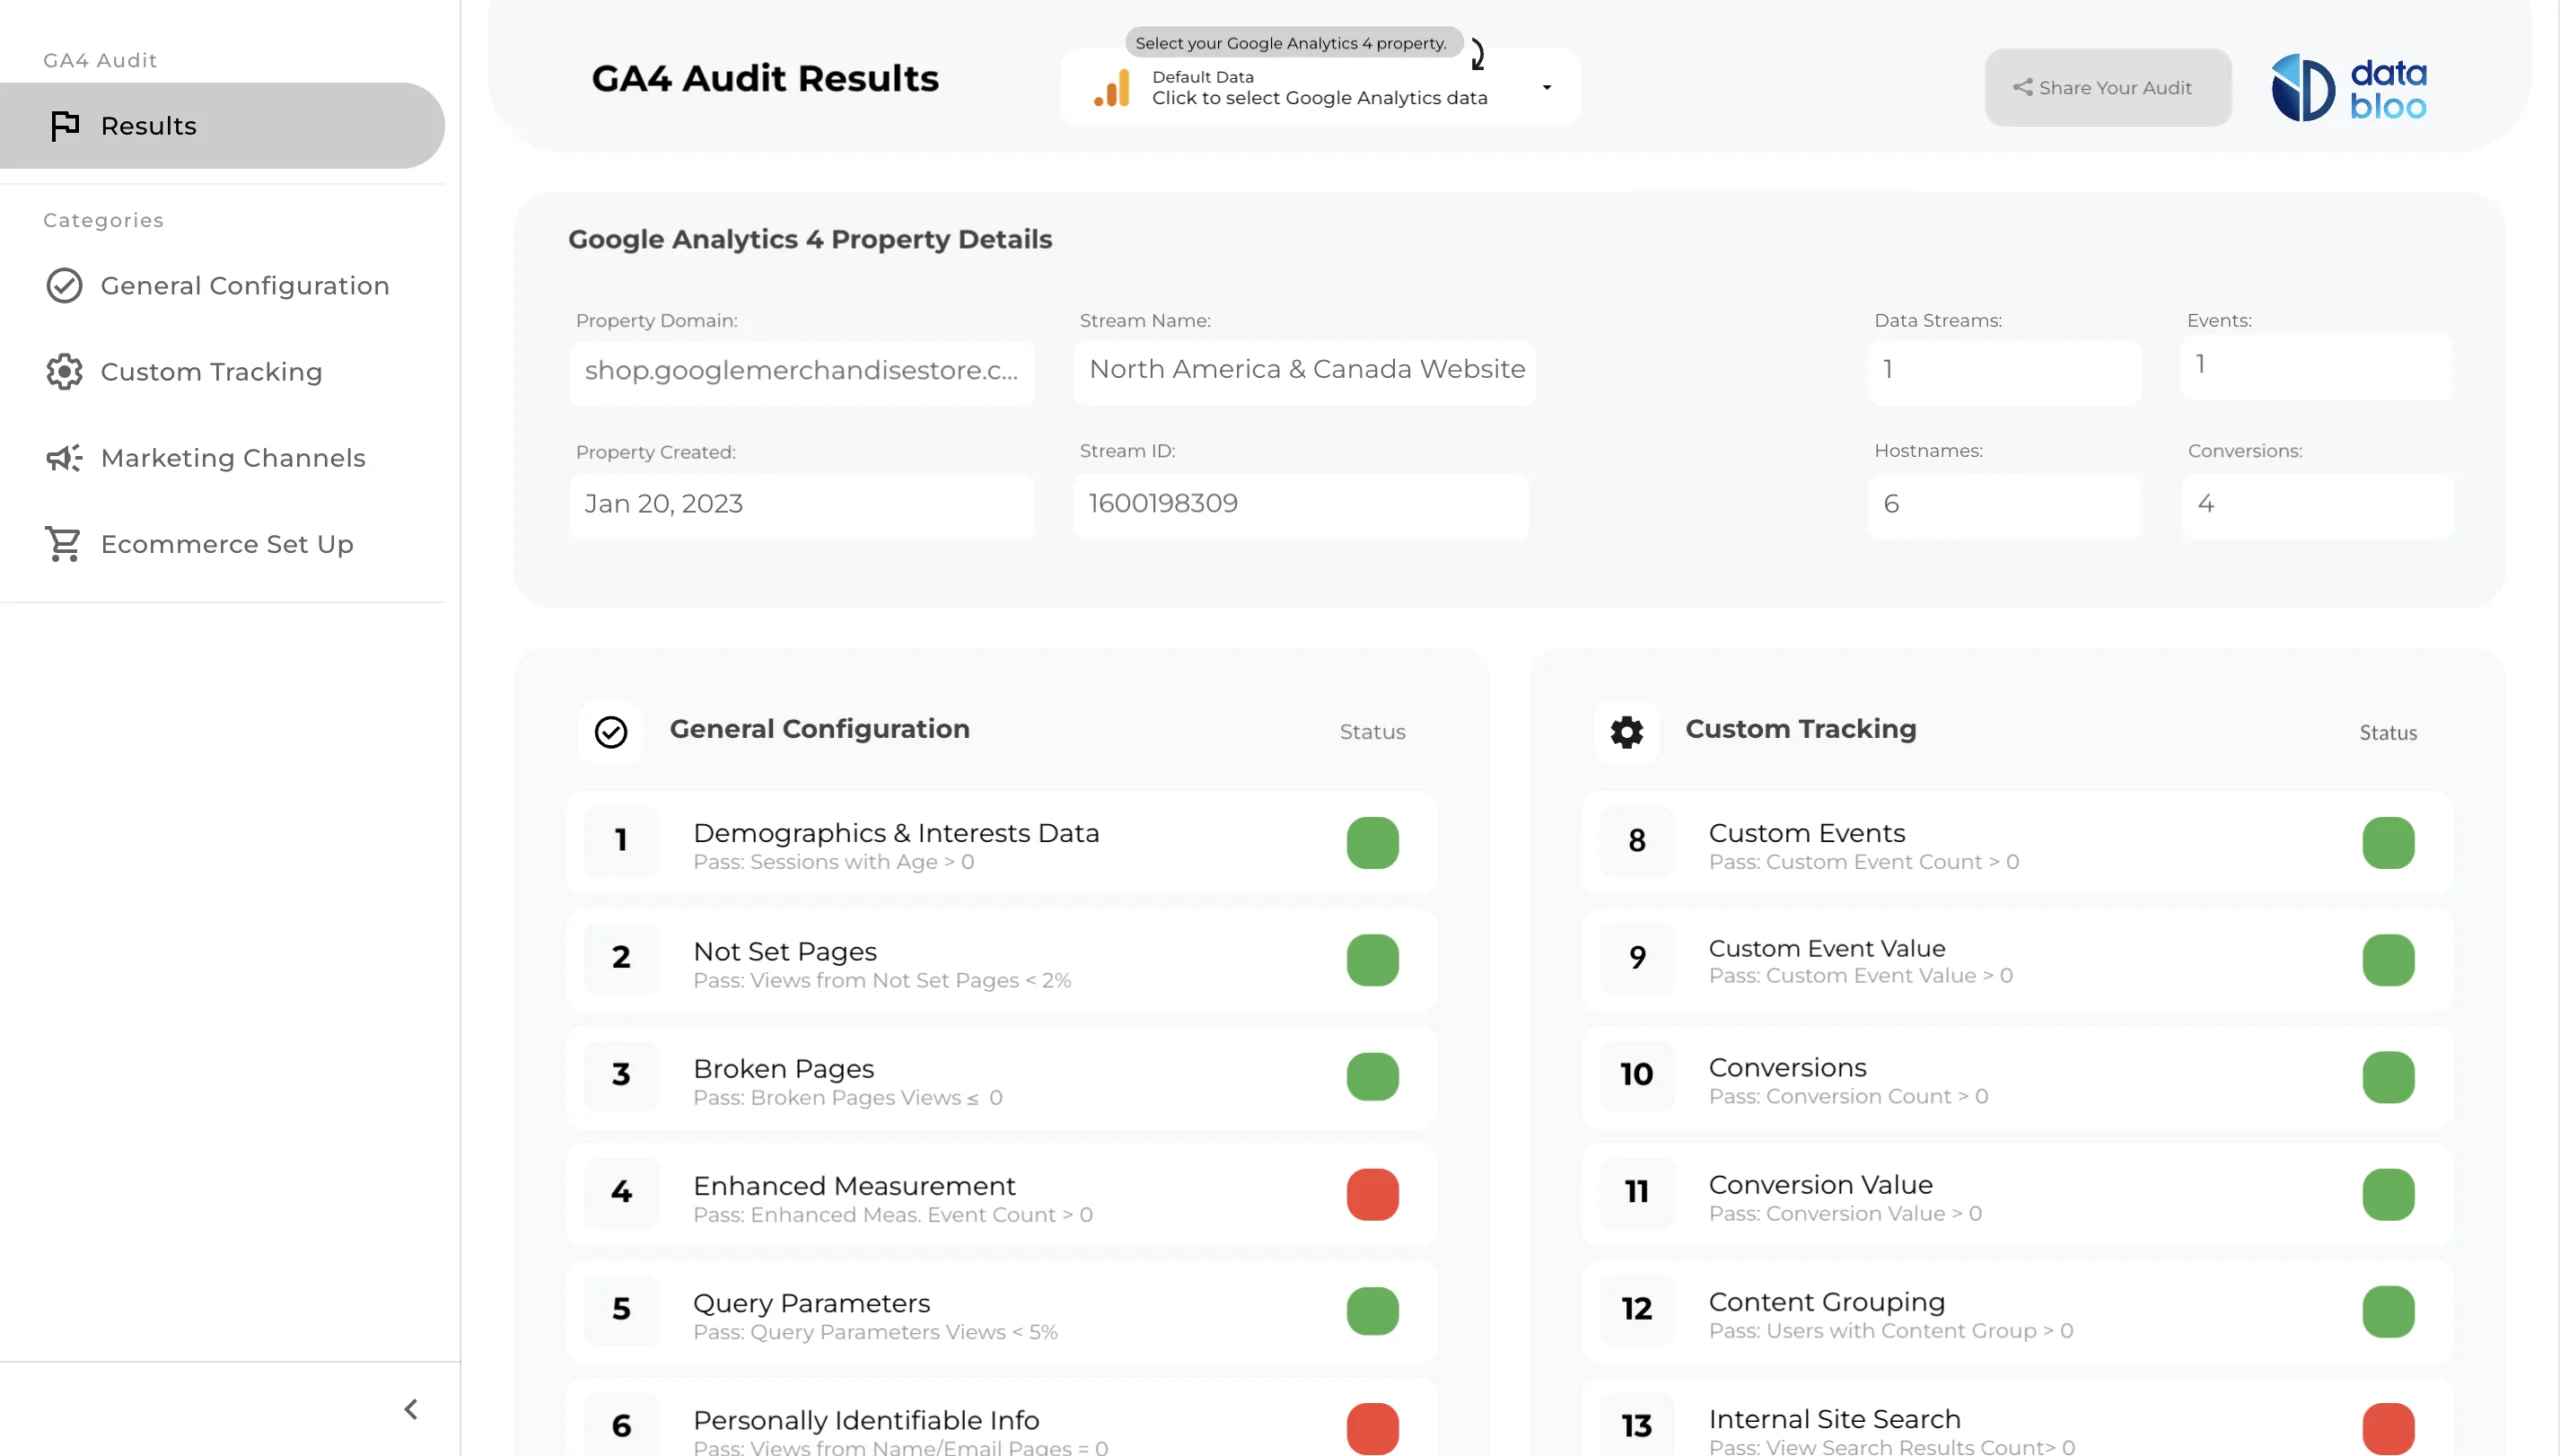
These run entirely on Google’s own free connectors, so there’s no licence for you or for anyone who reads them:

Frequently asked questions
Is Data Studio better than Power BI for marketers?
For marketing reports on Google data that go to clients or colleagues, usually yes on cost: Data Studio is free to build and to read, while every Power BI reader needs a $14 Pro licence unless the company has F64/P1 capacity or Microsoft 365 E5. For data modelling, large datasets and governed metrics, Power BI is the stronger tool.
Is Looker Studio the same as Data Studio?
Yes. Google renamed it back to Data Studio in April 2026; the product is the same. Looker is a separate enterprise BI platform.
Does Microsoft have an equivalent to Data Studio?
Power BI is Microsoft’s closest equivalent. The difference is licensing: its free account can’t share, and readers need Pro at $14 per user per month unless the content sits on F64 or P1 capacity.
Can Power BI or Tableau connect to Google Ads?
Not with a connector of their own. Neither Microsoft’s Power Query connector index nor Tableau’s supplied-connector list includes Google Ads or Search Console (checked 13 October 2026). Both reach them through third-party connectors or a warehouse such as BigQuery. Data Studio connects to both natively.
Where to go next
- Looker, Looker Studio and Data Studio: three names, two products
- Data Studio free vs Pro
- Data Studio connectors compared, for Meta, LinkedIn and TikTok
- Marketing reporting tools compared
- What is Data Studio? A complete beginner’s guide
- The best free Data Studio templates
Some links in this post are affiliate links: if you sign up through one, I may earn a commission at no extra cost to you. How I work with partners.