
ChatGPT, Claude and Gemini can do most of the thinking and writing in a Data Studio build: the metric plan, the page layout spec, calculated fields, chart titles and a design critique. They can’t see your data or click anything in the editor, and they often write formulas with functions or fields that don’t exist. Give them your field list and Data Studio’s function list, and check every output in the report before it ships.
An assistant is a fast junior who has never seen your report. (Data Studio was called Looker Studio until 2026, so most prompt advice online still says Looker Studio.) This covers:
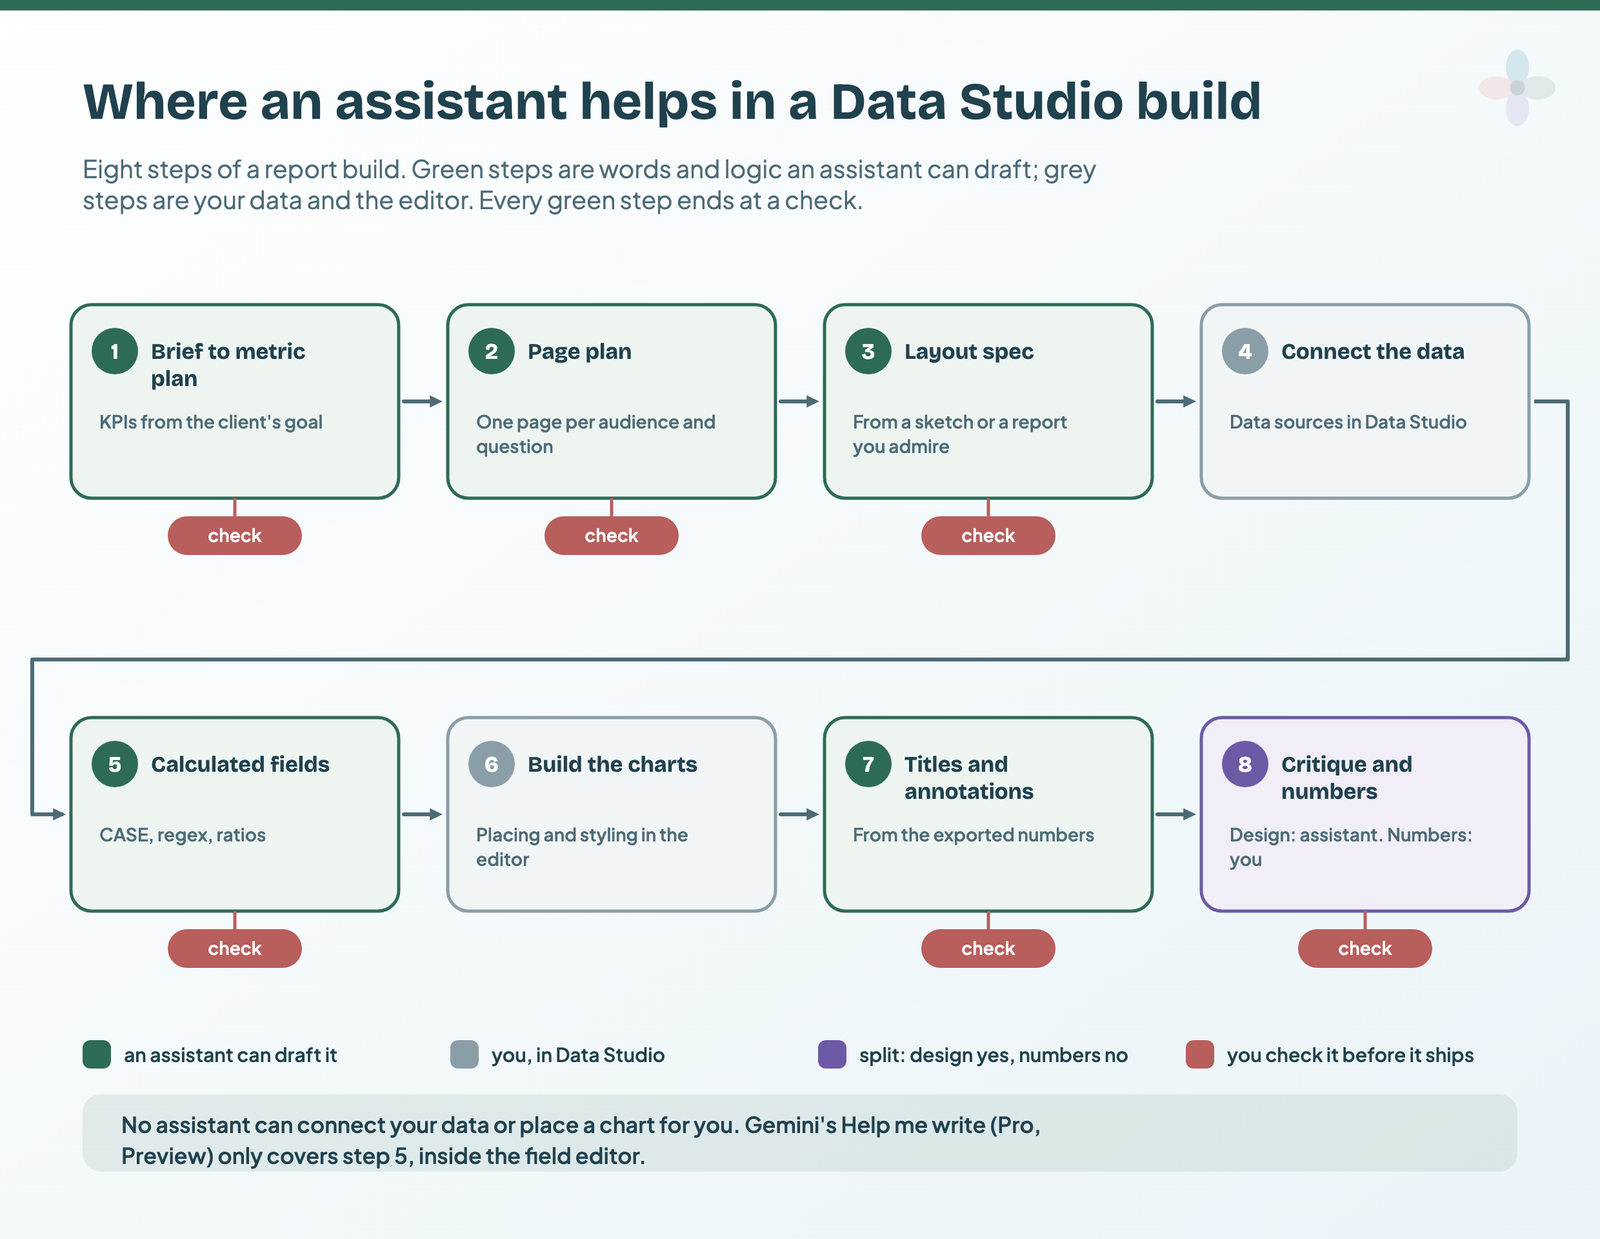
- which parts of a build to hand over, and which to keep
- the two pastes that stop invented field names
- prompts for each stage: plan, layout, formulas, titles, critique
- the eight ways AI-written formulas fail, with the fix for each
- what Gemini’s built-in Help me write adds on Pro
- the full prompt library, as a Google Sheet to copy
On the evidence: the prompts are mine, written from how I build reports. I haven’t benchmarked them across models, so each one comes with what to check. Product facts are from Google’s documentation, read on 14 October 2026; the failure modes come from 12 threads on Google’s Data Studio forum. I haven’t used Gemini’s Help me write for this post, because it needs Pro.
What an assistant can do for your Data Studio build, and what stays with you
The split is simple. Words and logic go to the assistant. Your data and the clicks stay with you. Gemini’s Help me write sits in between: it only does formulas, but it can see your data source’s fields.
| Build step | ChatGPT, Claude or the Gemini app | Gemini Help me write (Pro) | You |
|---|---|---|---|
| Brief → metric set | Good first draft | No | Check every KPI is a field you have |
| Page plan | Good first draft | No | One audience per page |
| Layout spec from a sketch | Yes, from an image | No | Place every component |
| Calculated fields, CASE, regex | Yes, from your pasted field list | Yes, reads your schema | Test against a known number |
| Debugging an error message | Yes | Refine the formula | Paste the exact error |
| Chart titles and annotations | Yes, from exported numbers | No | Strike any cause it adds |
| Critique of a screenshot | Yes, against a checklist | No | Decide what matters |
| Connecting data | No | No | Yes |
| Building charts in the editor | No | No | Yes |
| Checking the numbers are right | No | No | Yes |
Help me write’s scope from Google’s Create calculated fields with Gemini, read 14 October 2026.
If you’re new to the build itself, my first-report walkthrough covers the clicks. Every AI feature inside Data Studio is in the AI in Data Studio guide.
Before you prompt: hand over your field list and Data Studio’s real functions
Help me write is given your data source’s schema. A chat assistant only knows what you paste. That gap explains most bad output: without your field list, it can write “Conversions”, a metric GA4’s schema doesn’t have (the name is Key events).
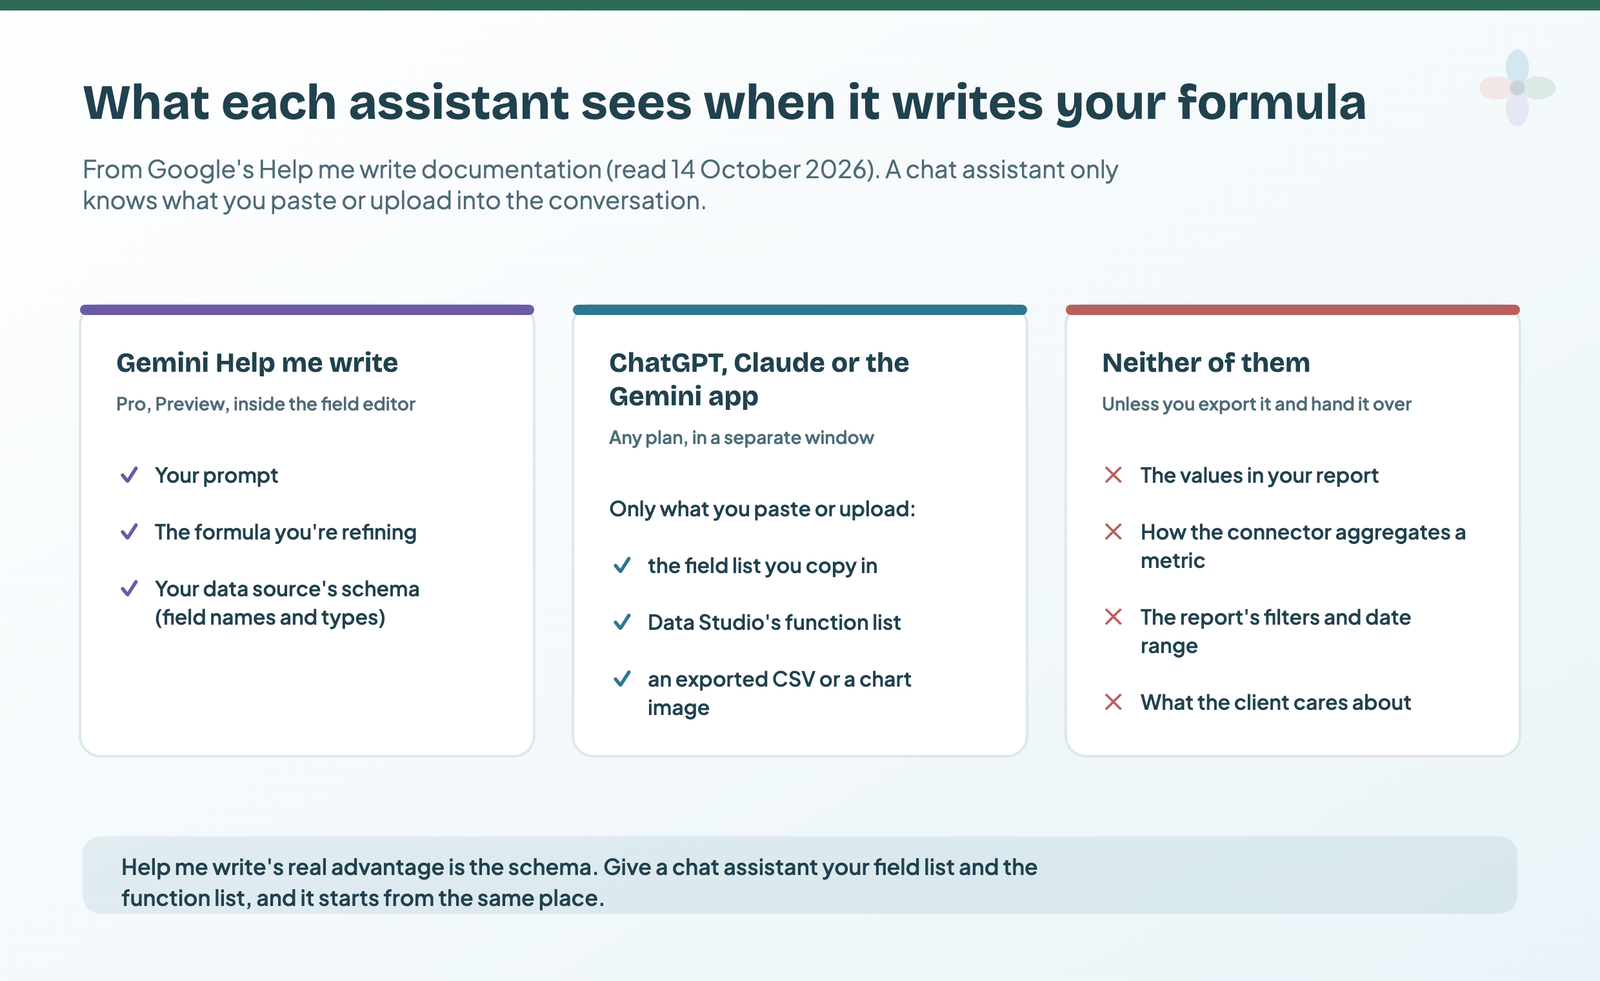
So paste two things first. Your field list, exactly as the data source shows it: name, dimension or metric, type. Say whether the source is pre-aggregated: most GA4 and Google Ads metrics arrive as totals, while a Google Sheet sends raw rows. That one line decides whether SUM() is right or an error. And Data Studio’s function list: there are 85 functions, and anything outside them won’t work.
I'm building a report in Google Data Studio (formerly Looker Studio). Rules for every answer:
1. Use only the fields listed below, spelled exactly as written. If you need one that isn't listed, say so.
2. Use only functions from Data Studio's function list (pasted below). No spreadsheet functions
   (SUMIF, COUNTIF, IFERROR, VLOOKUP) and no BigQuery SQL functions (SAFE_DIVIDE, DATE_SUB).
3. Connector: [CONNECTOR]. Pre-aggregated: [YES/NO]. If yes, don't wrap metrics in SUM, AVG or COUNT.
4. If it can't be done in a calculated field (needs a blend, a filter, a parameter or a source change),
   say that instead of writing a formula.
Fields (name | dimension or metric | type):
[PASTE FIELD LIST]
Functions:
[PASTE FUNCTION NAMES]
That’s prompt C01 in the library, where a formula builds it from your field list for you. For analysis or critique, give it the numbers too. In view mode, a chart’s menu offers Export (CSV, CSV for Excel or Google Sheets, with the report’s filters and date range applied, up to 750,000 rows) and Copy image to clipboard. The report owner can switch exporting off. ChatGPT (uploads; three a day on the free plan), Claude (CSV and images) and the Gemini app (spreadsheets and photos) all accept both.
Plan the metric set and the pages from a client brief
An assistant makes a good first-draft planner if you give it the goal, the audience and the sources. Two prompts, in order:
- Brief → metrics (P01). Ask for up to eight KPIs, each with the field it comes from.
- Metrics → pages (P02). Ask for one page per audience, each answering one question.
P01  Here's a client brief: [PASTE BRIEF]. The audience is [AUDIENCE]. The data sources are [SOURCES].
Propose up to 8 KPIs as a table: KPI · outcome or input metric · why it matters to this audience ·
the field it comes from (from my field list only) · the comparison it needs.
Mark any KPI that my fields can't produce.

P02  Using these KPIs: [PASTE KPI TABLE], plan the report's pages. For each page: name · who reads it ·
the one question it answers · 3 to 6 components with the KPI each shows · the controls it needs.
Put the executive summary page first. Keep one audience per page.
What to check before you accept the plan:
- Every KPI is a field you have. Look each one up in the field list.
- Every KPI has a subject, a period and a comparison (the rule from my design principles).
- A mix of outcome and input metrics, as in metrics that tell a story.
- The executive page comes first, and each later page follows a narrative, not a data source.
Turn a sketch or screenshot into a layout spec you can build
Image-capable assistants read a whiteboard photo well enough to list its components. Ask for the spec in Data Studio’s vocabulary: canvas size, slots, and chart types from Data Studio’s chart list. Then you place each component yourself.
L01  This image is a sketch of a Data Studio report page. Turn it into a build spec table:
slot · component · chart type (Data Studio chart type names) · dimension · metric · comparison ·
filter or control. Canvas: [WIDTH] x [HEIGHT] px. Use only fields from my field list.
List anything in the sketch you can't identify instead of guessing.
Here’s the shape of output to expect. I wrote it by hand as an example; it isn’t a model run.
| Slot | Component | Chart type | Dimension | Metric | Comparison |
|---|---|---|---|---|---|
| Row 1, ×4 | KPI cards | Scorecard | — | Sessions, Key events, Session key event rate, Ads cost | Previous period |
| Row 2, left | Trend | Time series | Date | Sessions | Previous year |
| Row 2, right | Channel mix | Bar chart | Session default channel group | Key events | — |
| Header | Controls | Date range control | — | — | Applies to page |
An example written for this post, using GA4’s field names. Check the names in your own field list.
Check the spec against the canvas and grid numbers, and that four scorecards fit a row. For colours from a logo or brand image you don’t need AI: Data Studio’s Extract theme from image, on the Theme tab, builds a theme from an image’s colours (then tune it with a colour palette). For a report you admire, pick one from the templates at the end of this post and run L02 on its screenshot.
Write calculated fields, CASE and regex, then prove them
This is where assistants save the most time and cause the most damage. Ask for one field at a time, name the type you want, and repeat whether the source is pre-aggregated. Three prompts from the library cover most jobs:
F01  [context header] Write one calculated dimension that groups [SOURCE FIELD] into these buckets:
[LIST BUCKETS AND RULES]. Use CASE WHEN … THEN … ELSE … END. Return the formula only, then one line
per WHEN explaining it.

R01  [context header] Write a REGEXP_EXTRACT that returns [PART] from [FIELD]. Escape special characters
with a double backslash, as Data Studio requires. Give me 5 example inputs and the expected output.

D01  [context header] Data Studio shows this error: "[PASTE ERROR EXACTLY]" for this formula:
[PASTE FORMULA]. Explain what it means in Data Studio and give a corrected formula. If it can't be
fixed inside a calculated field, say so.
Then prove it, in this order:
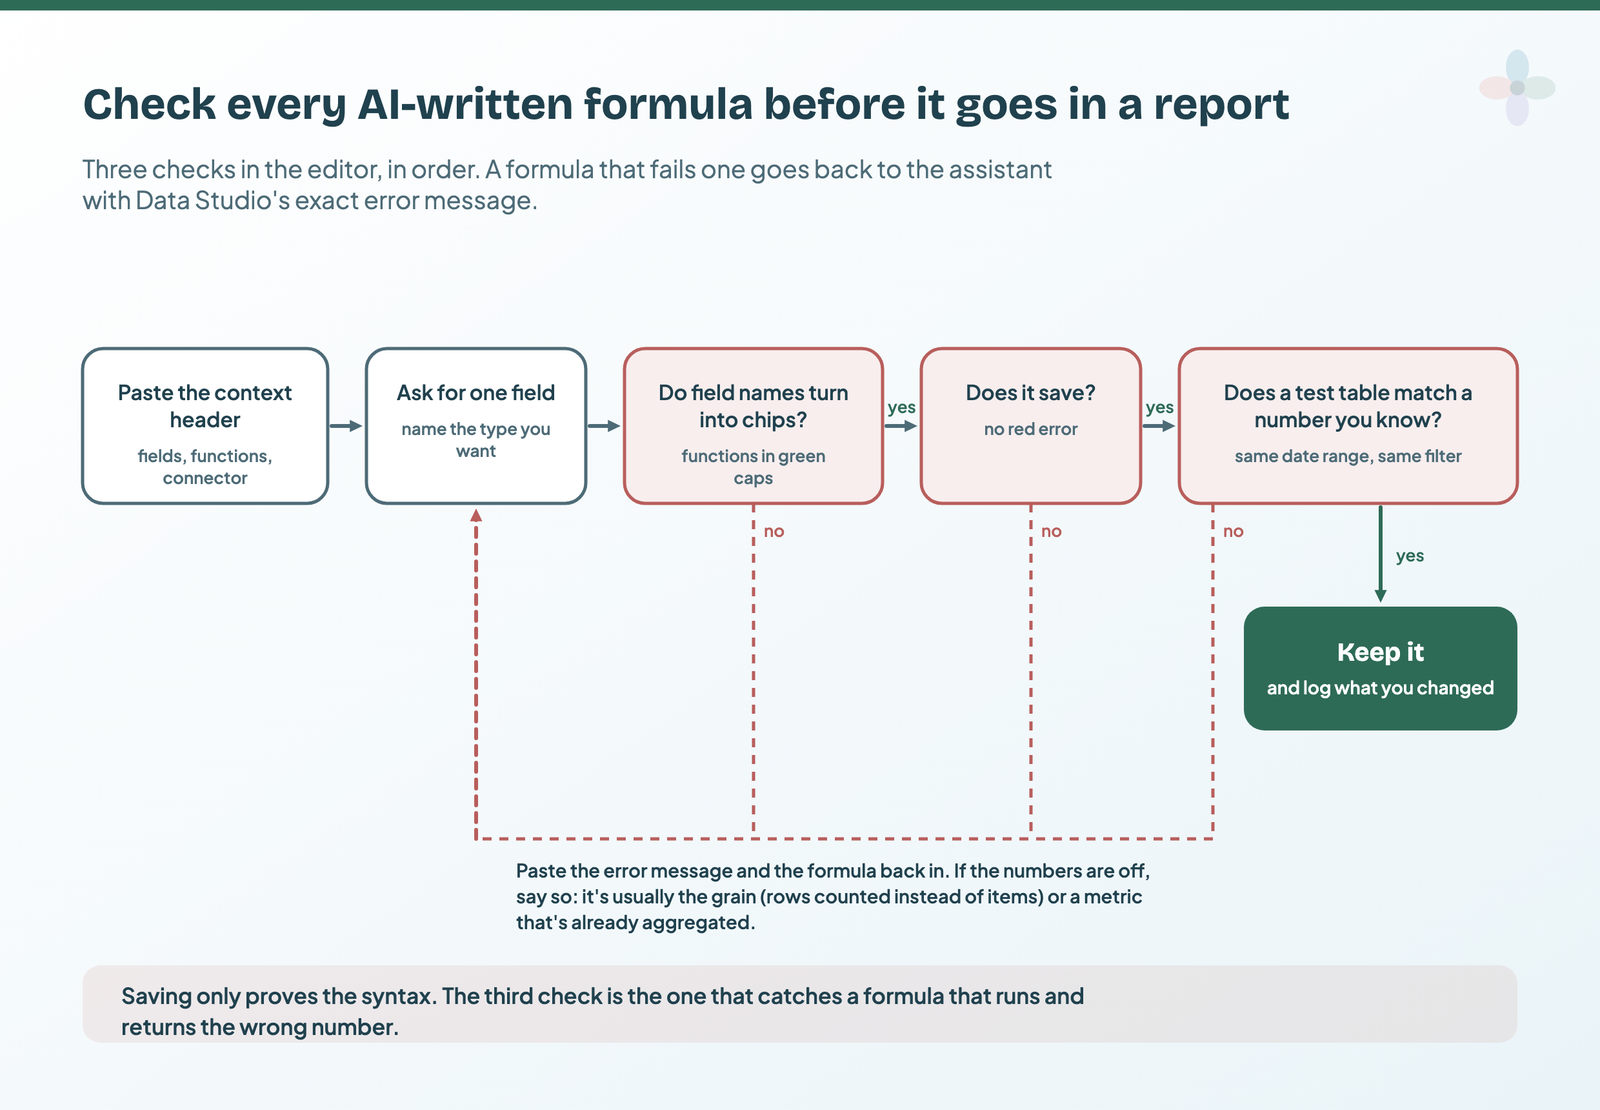
- Paste it into the formula editor. Valid fields turn into green or blue chips and valid functions show in green capitals. Plain text means a field or function Data Studio doesn’t recognise.
- Save it. A red error goes straight back into D01, word for word.
- Test it in a table against a number you already know, for the same date range and filters. Saving only proves the syntax.
Two rules assistants rarely know. A calculated field made in the data source can’t be used with blended data; a chart-specific field (made in the chart) can. And in regex, special characters need a double backslash. The full syntax, CASE patterns and regex recipes are for the Calculated Fields guides.
Eight ways AI-written formulas fail in Data Studio, and the fix for each
I searched Google’s Data Studio forum for threads where someone had used ChatGPT or Gemini on a formula or setup problem, and found 12, from July 2024 to November 2025. In 10, the AI answer didn’t work. It’s a small sample, and people post when things fail, so read it as a direction, not a rate. The failures fall into eight types, and the worst one compiles.
| Failure | What it looks like | Error (Google’s list) | Fix |
|---|---|---|---|
| 1. Invented field names | “Session Conversions”, “Ad Spend” (GA4’s names are Key events and Ads cost) | Invalid field name; no chip | Paste your field list (C01) |
| 2. Spreadsheet functions | SUMIF, COUNTIF, IFERROR, VLOOKUP | Invalid function name | Lookalike table below |
| 3. BigQuery SQL functions | SAFE_DIVIDE, DATE_SUB, window functions | Invalid function name | Paste the function list |
| 4. Looker / LookML mix-ups | Answers drawn from Google’s enterprise Looker, a different product | Varies: no single message | Name the product in the prompt (C01 does); see the three names |
| 5. Re-aggregating GA4 or Ads metrics | SUM(Sessions) |
Re-aggregating metrics is not supported | Divide metrics directly on pre-aggregated sources |
| 6. Dimensions and metrics in one expression | A CASE on a dimension that returns a metric | An expression can have either metrics or dimensions, but not both | A chart filter on GA4 or Ads; SUM(CASE …) on raw rows |
| 7. Legacy or undocumented date logic | DATE_DIFF, TODATE; a computed interval in DATETIME_SUB | DATE_DIFF and TODATE support compatibility-mode dates only | DATETIME_DIFF, PARSE_DATE; for the interval, a forum fix: CAST(… AS INT64) (undocumented) |
| 8. Right syntax, wrong grain | A count of news items that returned 2,717; a hand count found 62 | Nothing: it saves | Test against a known number |
Error wording from Google’s calculated field troubleshooting page; GA4 names from the GA4 API schema; read 14 October 2026.
A few of these from the threads. Google’s own AI Overview for “chatgpt prompts for looker studio” (14 October 2026) gives an example metric built on “Ad Spend” and “Session Conversions” (failure 1, and wrapped in SUM, failure 5 as well). Even a human answer on the forum suggested SAFE_DIVIDE, a BigQuery function the asker found Data Studio “did not support”. After two hours with ChatGPT, one person’s DATETIME_SUB still failed; the fix a community member offered was to cast the interval, which they said is “not documented”. And the news-item count was most likely counting page views, not items: nothing in the editor will tell you that.
Failure 2 isn’t confined to forums. A LinkedIn post this spring offered “ready-to-copy” Data Studio fields written by an assistant; two of the four used SUMIF and COUNTIF, which Data Studio doesn’t have. Here are the nearest Data Studio equivalents:
| The assistant wrote | Nearest Data Studio approach |
|---|---|
| COUNTIF | SUM(CASE WHEN … THEN 1 ELSE 0 END) on raw-row sources (CASE) |
| SUMIF | SUM(CASE WHEN … THEN metric ELSE 0 END), raw-row sources only |
| IFERROR | IFNULL, or NULLIF in a denominator |
| VLOOKUP | A blend, not a calculated field |
| SAFE_DIVIDE | a / NULLIF(b, 0) |
| LEN · LEFT | LENGTH · LEFT_TEXT |
| NOW · WEEKNUM | CURRENT_DATETIME · WEEK or YEARWEEK |
| DATE_SUB | DATETIME_SUB |
Checked against Google’s function list, 13–14 October 2026. Nearest equivalent, not a perfect match; the Calculated Fields guides cover the edge cases.
Chart titles, annotations and the one-line summary
Assistants draft good titles if you tell them the rule: subject, period, comparison. Commentary is riskier, because an assistant will happily supply a cause the data doesn’t show. An annotation records an event; it doesn’t prove one. So hand over exported numbers and an event log, and forbid causes.
T01  Write a title for each chart in this spec: [PASTE SPEC ROWS]. Each title states the subject,
the period and the comparison. No adjectives, no conclusions.

T02  Here are dated events: [PASTE EVENT LIST] and the chart's data: [PASTE CSV]. Write a short
annotation for each event (under 12 words) that says what happened and when. Don't state that an
event caused a change in the numbers.| Before | After |
|---|---|
| Traffic | Organic sessions, last 28 days vs the previous 28 |
| Great month for conversions! | Key events by channel, September vs August |
| Campaign performance | Google Ads cost per key event, by campaign, this quarter |
My own examples.
Check every number in a summary line against the CSV, and run the result through the so-what test. Generating client commentary at scale is its own job, covered in AI commentary for client reports. For the titles themselves, Chapter 17 of my ebook, Data Storytelling in Data Studio, has thirty to adapt by channel, and the case for question titles on live pages and answer titles on dated ones.
Critique a dashboard screenshot against design principles
For a second opinion on a draft page, take a screenshot of the page (or copy one chart: Copy chart as image started rolling out on 13 August 2026) and paste it with a checklist. “Is this good?” gets you compliments. A checklist gets you a list.
K01  This is a screenshot of one page of a Data Studio report for [AUDIENCE]. Critique it against
this checklist: [PASTE CHECKLIST]. Output a table: issue · principle · where on the page ·
suggested fix · how confident you are. Don't comment on whether the numbers are right;
you can't see the data behind them.
Use the checklist from my design principles, plus the “charts that are usually a mistake” list in the chart types guide. An assistant can judge hierarchy, clutter, labels, colour use and chart choice from pixels. What it can’t see:
- whether the numbers are right, or filtered the way you think
- what the client actually decides with this page
- how the page behaves on a phone (that’s a separate check, K03 in the library)
- anything below the fold you didn’t capture
Gemini’s Help me write on Pro: what it adds, and what it needs
Inside Data Studio, Gemini can write calculated fields for you. It’s the one AI step that sees your schema without a paste. The conditions, from Google’s docs:
| Help me write at a glance | From Google’s docs |
|---|---|
| Who | Users under a Data Studio Pro subscription, with Gemini enabled for the Pro project |
| Status and cost | Preview; no extra cost during the preview, possibly a fee afterwards. Pro is $9 per user per project per month |
| Switching it on | A Pro admin enables Gemini and the Trusted Tester features switch; Gemini is on by default for Pro subscriptions created on or after 3 June 2025 |
| What it reads | Your prompt, the formula you’re refining, and the data source’s schema |
| What it won’t do | Suggest parameters or NATIVE_DIMENSION; fields a calculated field can’t produce |
| Language | English prompts and responses only |
| Google’s warning | Gemini “can generate output that seems plausible but is factually incorrect”: validate everything |
From Create calculated fields with Gemini, Enable and disable Gemini and Troubleshooting Gemini, read 14 October 2026. Pro price from Google’s pricing page, checked 13 October 2026.
Field Editing in Reports must be on in the data source. Then, per Google’s steps:
- Edit the data source and choose Add a field › Add calculated field.
- Click the Help me write icon at the bottom right of the field editor.
- Describe the field, then Refine, Apply and Save.
Its real advantage is the schema, which a chat assistant gets from your paste. The same three checks apply to what it writes. Whether Pro is worth it for this alone is a question for Data Studio free vs Pro; the rest of Gemini on Pro is in the AI guide.
What none of them can do yet: open the editor or read your report
People keep looking for a connection that doesn’t exist, so here’s where things stand.
| You want | What exists today | Where it’s covered |
|---|---|---|
| An assistant that reads a Data Studio report | No MCP server; a Google staff member said on 1 September 2026 there’s “no defined timeline” | AI guide |
| An API that pulls report data or builds charts | The Data Studio API manages assets and permissions only | The Data Studio API |
| A report generated from a prompt | Not in Google’s documentation | — |
| An assistant that sees your GA4 numbers | Connect it to GA4 itself, then check against your report | GA4 to Claude or ChatGPT |
| Chat with your data inside Data Studio | Conversational Analytics, with BigQuery data agents | Conversational Analytics |
From the Google forum thread and the API overview, read 14 October 2026.
Browser agents such as Claude in Chrome can read, click and navigate websites. I haven’t tried one on the Data Studio canvas, and I wouldn’t on a client report.
The prompt library, and how I’d use it on the next report
The Sheet has 33 prompts across nine stages, each with what to paste in, when to use it, what to check and the usual failure. They work the same in any of the three assistants. Written by me, not benchmarked.
| Stage | Prompt | When | What to check |
|---|---|---|---|
| Context | C01 context header | Before any formula | Names match the data source exactly |
| Plan | P01 brief → KPIs | New report | Each KPI is a field you have |
| Plan | P02 KPIs → pages | After P01 | One audience per page |
| Layout spec | L01 sketch → spec | Whiteboard or mock-up | Chart types exist in Data Studio |
| Formulas | F04 COUNTIF replacement | Conditional counts | Counts items, not rows |
| Debugging | D02 saves but wrong | Check table doesn’t match | Grain, aggregation, filters |
| Titles | T03 one-line summary | Executive page | Every number is in the CSV |
| Critique | K01 design critique | Before it ships | Issues point at the real page |
How I’d run the next build with it:
- Paste the context header into every new chat.
- One task per prompt.
- Fields turn into chips, and the formula saves.
- Test against a number you already know.
- Check the grain: rows, or the thing you meant to count?
- Log what you changed.
- Nothing AI-written goes to a client unread.
Templates to practise on
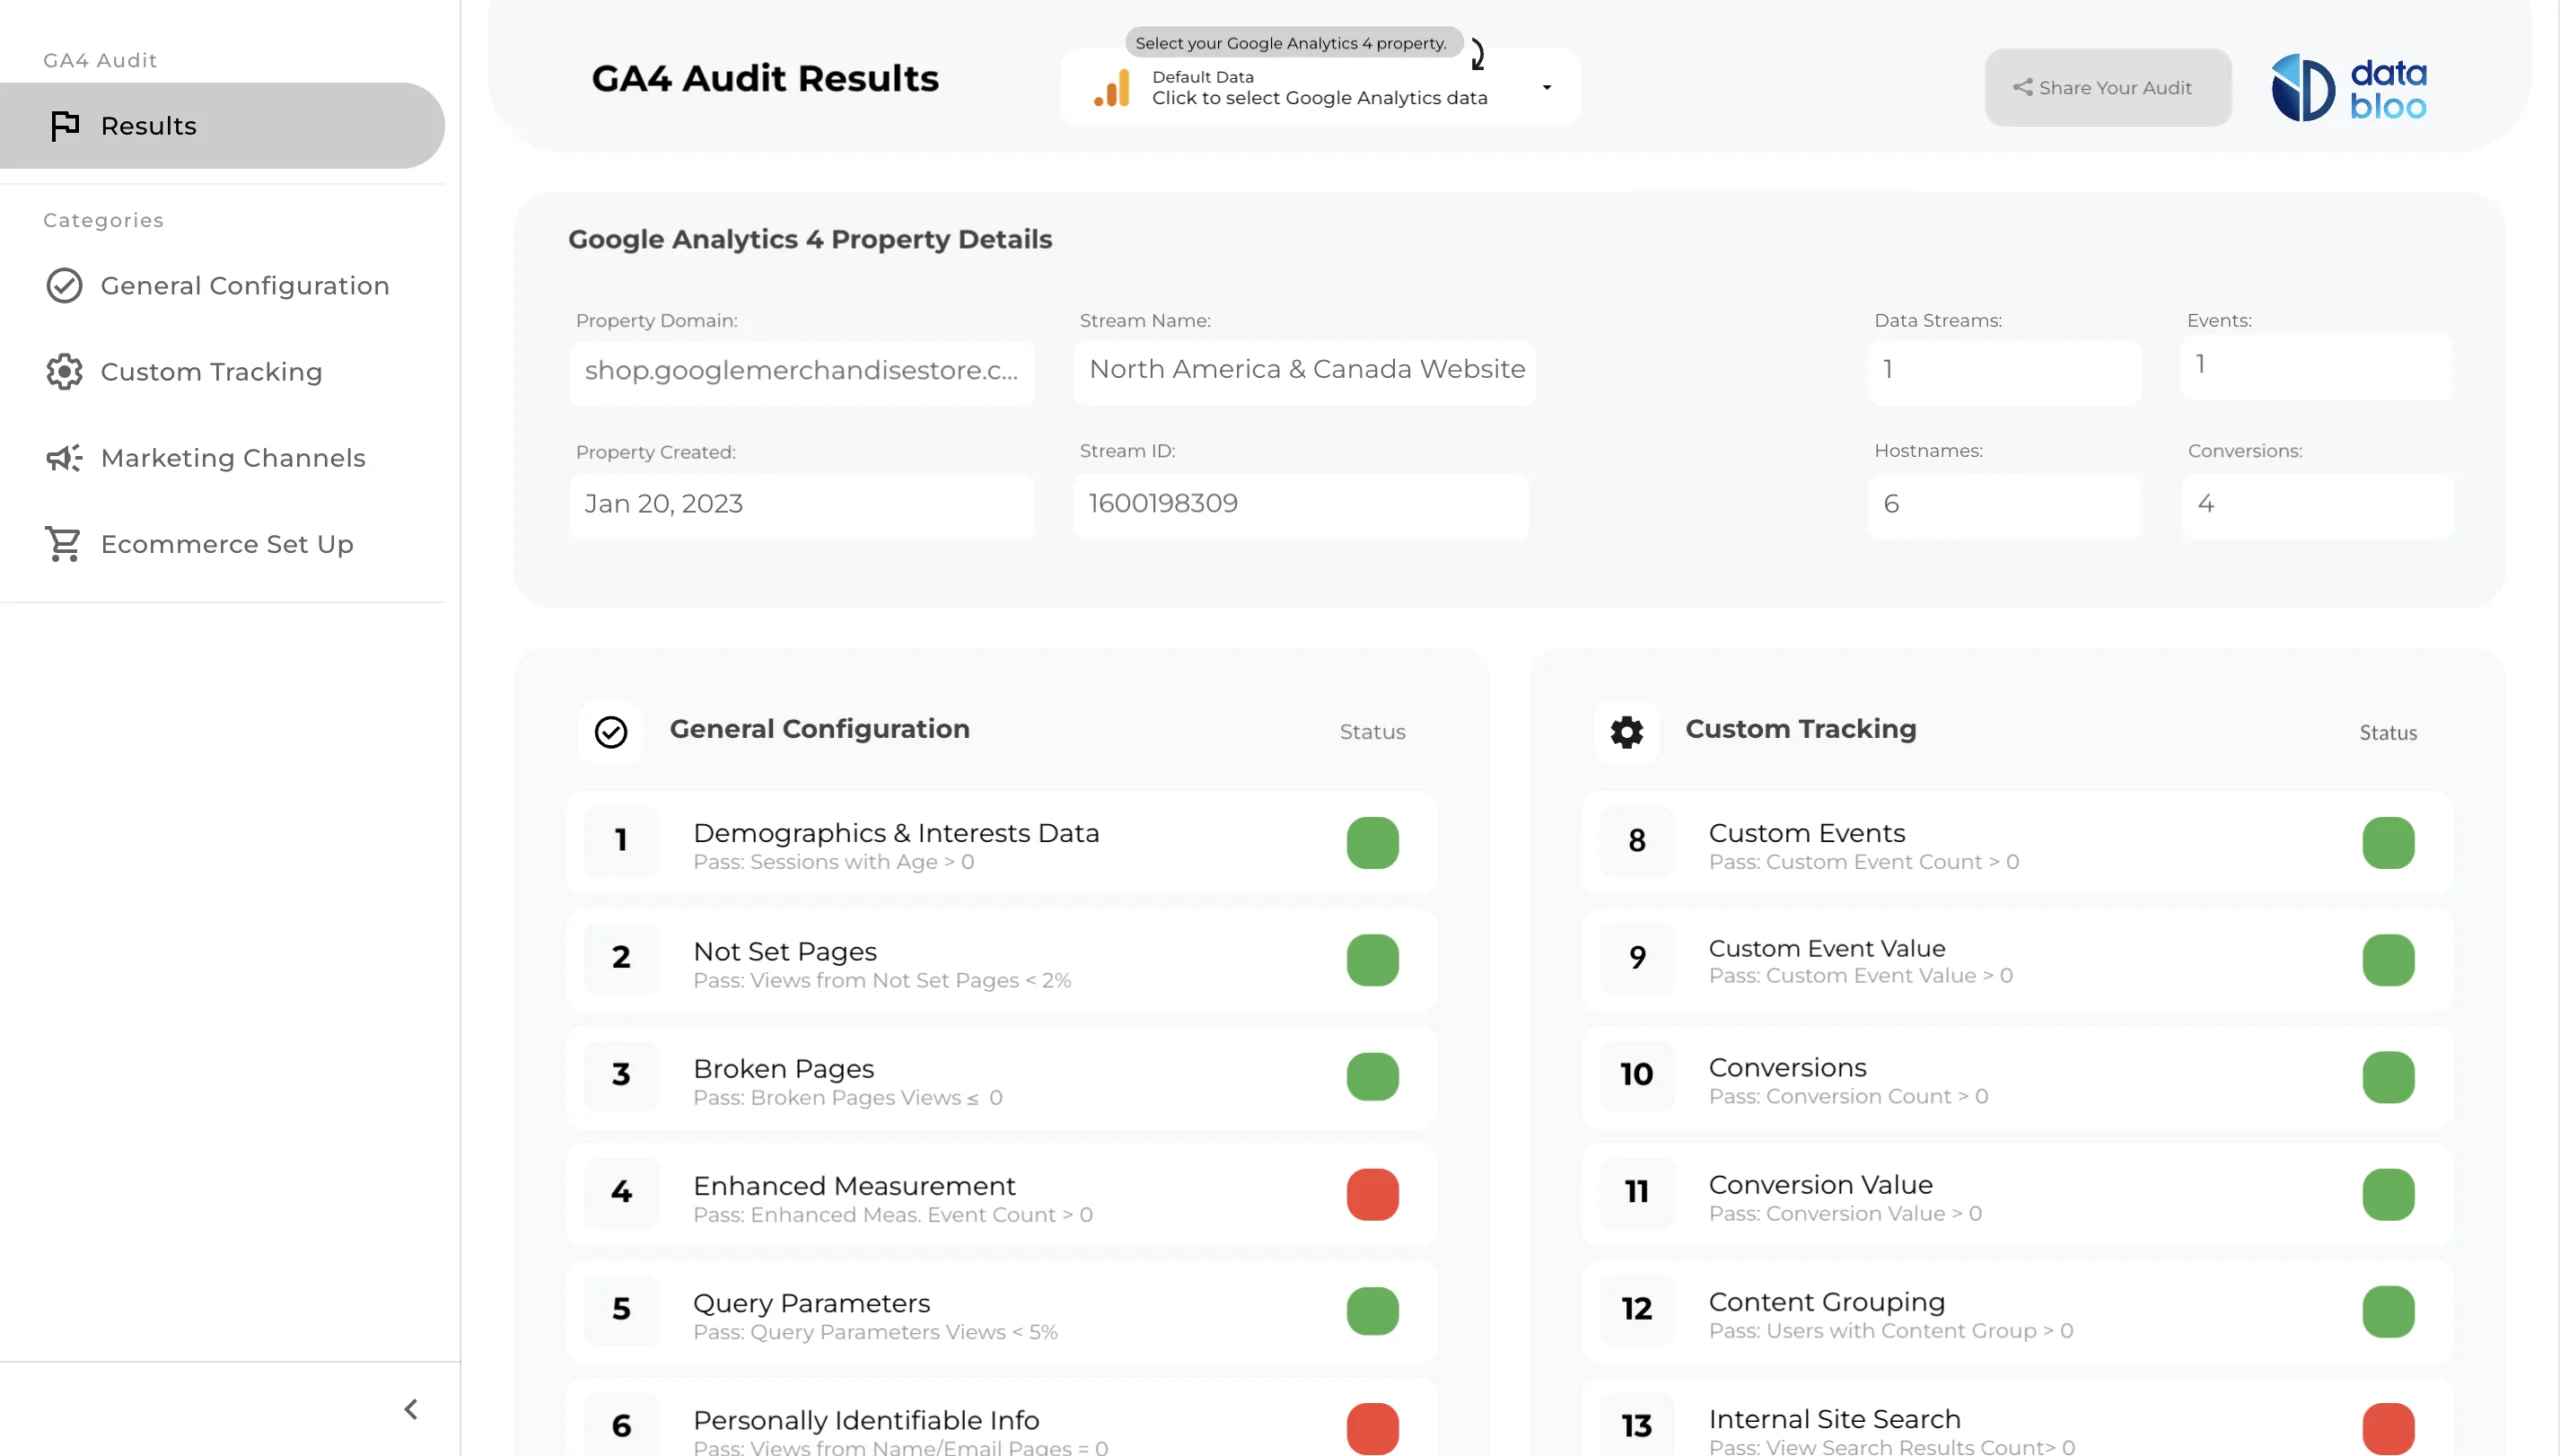
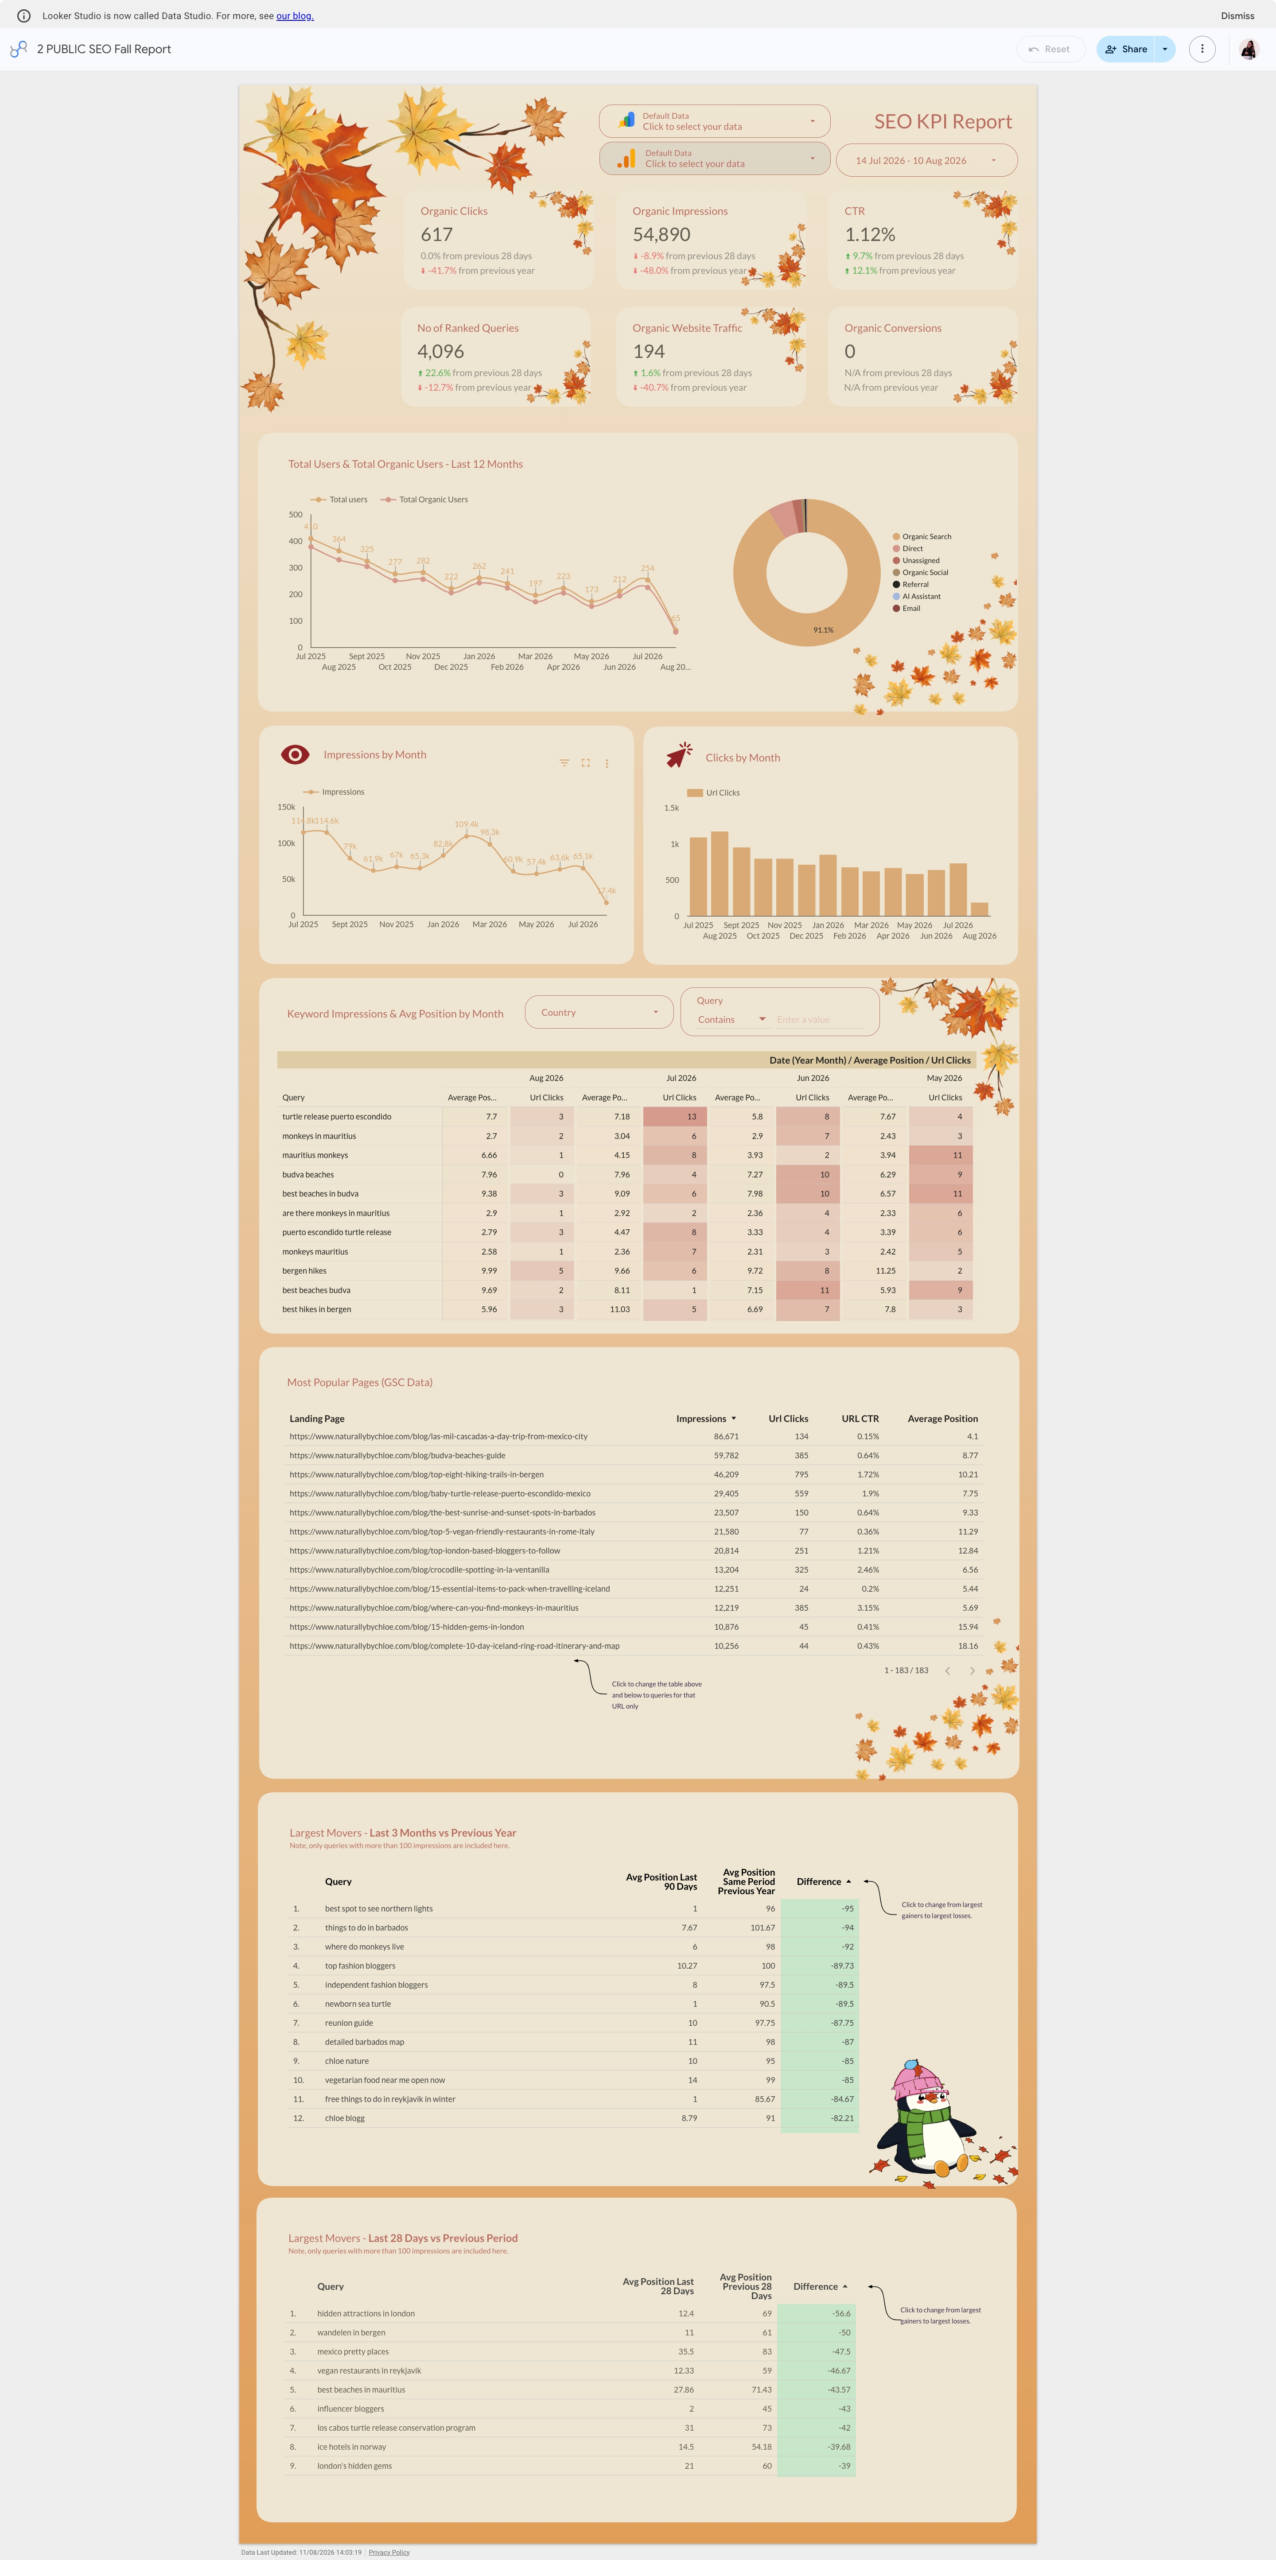
Both of these connect to your own GA4 (and Search Console) with Google’s free connectors, so you can run the layout-spec and critique prompts on a finished design.
Where to go next
- Dashboard design principles: the checklist the critique prompt uses
- Data Studio chart types: what the layout spec should choose from
- Metrics that tell a story: planning the metric set
- Data Studio free vs Pro: whether Pro, and Help me write, is worth it
- AI in Data Studio: every AI feature, and what’s free
- Create your first Data Studio report: the build, step by step
Frequently asked questions
Can ChatGPT connect to Data Studio?
Not to a report. There’s no MCP server and no API that reads one. Export a chart’s data or copy it as an image and upload that, or connect the assistant to the source itself, such as GA4.
Can Gemini write calculated fields on free Data Studio?
Not inside Data Studio: Help me write needs Pro and is in Preview. The Gemini app can, the same way ChatGPT and Claude can, from your pasted field list.
Which assistant writes the best Data Studio formulas?
I haven’t benchmarked them. The bigger difference is the context you give: your field list and Data Studio’s function list.
Why does my AI formula say “Invalid function name”?
It used a spreadsheet or SQL function Data Studio doesn’t have, such as COUNTIF or SAFE_DIVIDE. The lookalike table above has the nearest equivalents.
Is it safe to paste client data into an assistant?
Paste field names rather than data where you can, export only what the task needs, and check your agreement and the assistant’s data terms. What agencies need to check first covers it.
What is Looker Studio called now?
Data Studio. Google renamed it back in 2026.